Going forward, even with the new workflow with server models, I hope in the documentation (or a blog post) somewhere there can be added tips for debugging applications (beyond the documentation updates and fleshing out the server portions which are under-documented). I find that not knowing Flask and web frameworks in general, I don’t have a lot of intuition/direction on how to debug applications when something is going wrong. For example, I looked at the bokeh-server flags debugjs and splitjs, but didn’t understand how they could be used, and I also looked at --backend shelve, and was able to open the db files in Python, but didn’t know what was what, and how the pieces fit together to even begin to attempt to see what was incorrect.
···
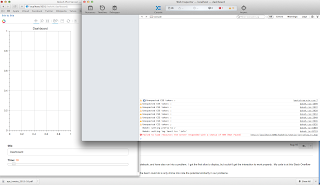
==========================
python version : 2.7.10
bokeh version : 0.9.2
listening : 127.0.0.1:5001
backend : memory
python options : debug:OFF, verbose:OFF, filter-logs:OFF, multi-user:OFF
js options : splitjs:OFF, debugjs:OFF
adding to python path
importing dashboard.py
/Users/me/anaconda/lib/python2.7/site-packages/bokeh/server/blaze/init.py:21: UserWarning: could not import multiuser blaze server No module named mbs.views. This is fine if you do not intend to use blaze capabilities in the bokeh server
warnings.warn(msg)
2015-08-18 10:49:36,790:INFO:tornado.access:200 GET / (127.0.0.1) 67.11ms
2015-08-18 10:49:36,950:INFO:tornado.access:304 GET /static/bootstrap/css/bootstrap.min.css (127.0.0.1) 56.89ms
2015-08-18 10:49:36,952:INFO:tornado.access:304 GET /bokehjs/static/js/bokeh.js (127.0.0.1) 1.32ms
2015-08-18 10:49:36,954:INFO:tornado.access:304 GET /bokehjs/static/css/bokeh.css (127.0.0.1) 1.79ms
2015-08-18 10:49:37,290:INFO:tornado.access:200 GET /bokeh/wsurl/ (127.0.0.1) 1.78ms
2015-08-18 10:49:37,406:INFO:tornado.access:200 GET /bokeh/userinfo/ (127.0.0.1) 1.05ms
index: 0
2015-08-18 10:49:40,676:INFO:tornado.access:200 GET /bokeh/dashboard/ (127.0.0.1) 2652.84ms
2015-08-18 10:49:40,688:INFO:tornado.access:304 GET /static/bootstrap/css/bootstrap.min.css (127.0.0.1) 2.23ms
2015-08-18 10:49:40,691:INFO:tornado.access:304 GET /bokehjs/static/js/bokeh.js (127.0.0.1) 1.50ms
2015-08-18 10:49:40,693:INFO:tornado.access:304 GET /bokehjs/static/css/bokeh.css (127.0.0.1) 1.27ms
2015-08-18 10:49:40,698:INFO:tornado.access:200 GET /bokeh/jsgenerate/VBox/dashboard/Dashboard (127.0.0.1) 4.67ms
2015-08-18 10:49:40,876:INFO:tornado.access:200 GET /bokeh/wsurl/ (127.0.0.1) 1.59ms
2015-08-18 10:49:41,633:INFO:tornado.access:200 GET /bokeh/objinfo/5f75f0e8-3526-47a5-b9e3-78079f3cc947/1422613c-e5af-40ac-8213-906645dc82eb (127.0.0.1) 735.75ms
index: 0
2015-08-18 10:49:54,827:INFO:tornado.access:200 GET /bokeh/dashboard/ (127.0.0.1) 380.24ms
2015-08-18 10:49:54,839:INFO:tornado.access:304 GET /static/bootstrap/css/bootstrap.min.css (127.0.0.1) 2.40ms
2015-08-18 10:49:54,841:INFO:tornado.access:200 GET /bokeh/jsgenerate/VBox/dashboard/Dashboard (127.0.0.1) 1.18ms
2015-08-18 10:49:54,843:INFO:tornado.access:304 GET /bokehjs/static/css/bokeh.css (127.0.0.1) 1.50ms
2015-08-18 10:49:54,845:INFO:tornado.access:304 GET /bokehjs/static/js/bokeh.js (127.0.0.1) 1.29ms
2015-08-18 10:49:55,033:INFO:tornado.access:200 GET /bokeh/wsurl/ (127.0.0.1) 1.13ms
2015-08-18 10:49:55,778:INFO:tornado.access:200 GET /bokeh/objinfo/2edf483d-7f30-4a78-b85e-e0e81e7621c7/8b5b7bf1-0e50-4b52-b5c8-f63dd9ff4f9f (127.0.0.1) 726.93ms
2015-08-18 10:50:02,202:WARNING:tornado.access:404 GET /bokehjs/static/js/jsnlog.js.map (127.0.0.1) 10.92ms
2015-08-18 10:50:22,386:INFO:bokeh.server.views.backbone:loading done 30
index: 1
2015-08-18 10:50:23,022:INFO:tornado.access:200 PUT /bokeh/bb/2edf483d-7f30-4a78-b85e-e0e81e7621c7/Slider/9a8d1101-0fb8-49ca-98bb-c38601cf9ff7/ (127.0.0.1) 858.92ms
2015-08-18 10:50:25,170:INFO:bokeh.server.views.backbone:loading done 30
index: 2
2015-08-18 10:50:25,798:INFO:tornado.access:200 PUT /bokeh/bb/2edf483d-7f30-4a78-b85e-e0e81e7621c7/Slider/9a8d1101-0fb8-49ca-98bb-c38601cf9ff7/ (127.0.0.1) 1034.16ms
2015-08-18 10:50:26,918:INFO:bokeh.server.views.backbone:loading done 30
index: 3
2015-08-18 10:50:27,549:INFO:tornado.access:200 PUT /bokeh/bb/2edf483d-7f30-4a78-b85e-e0e81e7621c7/Slider/9a8d1101-0fb8-49ca-98bb-c38601cf9ff7/ (127.0.0.1) 1018.27ms
2015-08-18 10:50:28,370:INFO:bokeh.server.views.backbone:loading done 30
index: 4
2015-08-18 10:50:29,009:INFO:tornado.access:200 PUT /bokeh/bb/2edf483d-7f30-4a78-b85e-e0e81e7621c7/Slider/9a8d1101-0fb8-49ca-98bb-c38601cf9ff7/ (127.0.0.1) 1026.00ms
2015-08-18 10:50:29,815:INFO:bokeh.server.views.backbone:loading done 30
index: 5
2015-08-18 10:50:30,438:INFO:tornado.access:200 PUT /bokeh/bb/2edf483d-7f30-4a78-b85e-e0e81e7621c7/Slider/9a8d1101-0fb8-49ca-98bb-c38601cf9ff7/ (127.0.0.1) 1010.68ms
2015-08-18 10:50:31,259:INFO:bokeh.server.views.backbone:loading done 30
index: 6
2015-08-18 10:50:31,889:INFO:tornado.access:200 PUT /bokeh/bb/2edf483d-7f30-4a78-b85e-e0e81e7621c7/Slider/9a8d1101-0fb8-49ca-98bb-c38601cf9ff7/ (127.0.0.1) 1017.56ms
2015-08-18 10:50:32,698:INFO:bokeh.server.views.backbone:loading done 30
index: 7
2015-08-18 10:50:33,340:INFO:tornado.access:200 PUT /bokeh/bb/2edf483d-7f30-4a78-b85e-e0e81e7621c7/Slider/9a8d1101-0fb8-49ca-98bb-c38601cf9ff7/ (127.0.0.1) 1037.37ms
2015-08-18 10:50:34,179:INFO:bokeh.server.views.backbone:loading done 30
index: 8
2015-08-18 10:50:34,847:INFO:tornado.access:200 PUT /bokeh/bb/2edf483d-7f30-4a78-b85e-e0e81e7621c7/Slider/9a8d1101-0fb8-49ca-98bb-c38601cf9ff7/ (127.0.0.1) 1079.25ms
2015-08-18 10:50:35,643:INFO:bokeh.server.views.backbone:loading done 30
index: 9
2015-08-18 10:50:36,269:INFO:tornado.access:200 PUT /bokeh/bb/2edf483d-7f30-4a78-b85e-e0e81e7621c7/Slider/9a8d1101-0fb8-49ca-98bb-c38601cf9ff7/ (127.0.0.1) 1009.32ms
2015-08-18 10:50:37,095:INFO:bokeh.server.views.backbone:loading done 30
index: 10
2015-08-18 10:50:37,744:INFO:tornado.access:200 PUT /bokeh/bb/2edf483d-7f30-4a78-b85e-e0e81e7621c7/Slider/9a8d1101-0fb8-49ca-98bb-c38601cf9ff7/ (127.0.0.1) 1030.01ms
“”"
This file demonstrates a bokeh applet, which can be viewed directly
on a bokeh-server. See the README.md file in this directory for
instructions on running.
“”"
import logging
logging.basicConfig(level=logging.DEBUG)
import os
import numpy as np
import random
from matplotlib.tri import Triangulation, LinearTriInterpolator
import matplotlib.cm as cm
import matplotlib as mplib
from bokeh.plotting import figure
from bokeh.models import Plot, ColumnDataSource
from bokeh.properties import Instance
from bokeh.server.app import bokeh_app
from bokeh.server.utils.plugins import object_page
from bokeh.models.widgets import VBox, Slider, TextInput, VBoxForm
#test
from bokeh.io import vform
def bokehPalette(cmapStr):
colormap =cm.get_cmap(cmapStr) #choose any matplotlib colormap here
return [mplib.colors.rgb2hex(m) for m in colormap(np.arange(colormap.N))]
#create data
x = np.linspace(-2,2,400)
y = np.linspace(-4,4,600)
X,Y=np.meshgrid(x,y)
meansx = np.cos(np.linspace(0,2np.pi,200))
meansy = np.sin(np.linspace(0,2np.pi,200))
stdevs = np.ones(meansx.shape)
tmp=
for mx,my in zip(meansx,meansy):
tmp.append(np.exp(-0.5*((X-mx)**2. + (Y-my)**2.)) / np.sqrt(2*np.pi) * 255)
data255=np.rollaxis(np.array(tmp),0,3)
class Dashboard(VBox):
“”“An example of a browser-based, interactive plot with slider controls.”“”
extra_generated_classes = [["dashboard", "Dashboard", "VBox"]]

inputs = Instance(VBoxForm)

text = Instance(TextInput)

time = Instance(Slider)

plot2D = Instance(Plot)
source = Instance(ColumnDataSource)

@classmethod
def create(cls):
    """One-time creation of app's objects.
    This function is called once, and is responsible for
    creating all objects (plots, datasources, etc)
    """
    obj = cls()

    obj.source = ColumnDataSource(data=dict(image=[data255[...,0]]))
    # obj.source = ColumnDataSource( data=dict(x=[],y=[]) )

    obj.text = TextInput(
        title="title", name='title', value='Dashboard'
    )

    obj.time = Slider(
        title="Time", name='time',
        value=0, start=0, end=data255.shape[-1]-1,step=1
    )

    toolset = "crosshair,pan,reset,resize,save,wheel_zoom"

    # Generate a figure container
    plot2D = figure(title_text_font_size="12pt",
                  height=data255.shape[0],
                  width=data255.shape[1],
                  # tools=toolset,
                  # title=obj.text.value,
                  x_range=[0, 1],
                  y_range=[0, 1]
    )

    # Plot the line by the x,y values in the source property
    plot2D.image('image', source=obj.source,
             x=[0],y=[0],dw=[1],dh=[1],
             palette=bokehPalette('jet')
    )
    # plot2D.line('x','y',source=obj.source)

    obj.plot2D = plot2D

    obj.update_data()

    obj.inputs = VBoxForm(
        children=[
            obj.text, obj.time
        ]
    )

    obj.children.append(obj.plot2D)
    obj.children.append(obj.inputs)
    return obj

def setup_events(self):
    """Attaches the on_change event to the value property of the widget.
    The callback is set to the input_change method of this app.
    """
    super(Dashboard, self).setup_events()
    if not self.text:
        return

    # Text box event registration
    self.text.on_change('value', self, 'input_change')

    # Slider event registration
    self.time.on_change('value',self,'input_change')
    for w in ["time"]:
        getattr(self, w).on_change('value', self, 'input_change')

def input_change(self, obj, attrname, old, new):
    """Executes whenever the input form changes.
    It is responsible for updating the plot, or anything else you want.
    Args:
        obj : the object that changed
        attrname : the attr that changed
        old : old value of attr
        new : new value of attr
    """
    self.update_data()
    self.plot2D.title = self.text.value

def update_data(self):
    """Called each time that any watched property changes.
    This updates the sin wave data with the most recent values of the
    sliders. This is stored as two numpy arrays in a dict into the app's
    data source property.
    """

    # Get the current slider values
    index = self.time.value
    # index = int(random.uniform(1,200))
    print 'index: '+str(index)

    logging.debug(
        "PARAMS: time: %s", self.time.value
    )

    self.source.data = dict(image=[data255[...,index]])
    # self.source.data = dict(x=data255[200,:,index],y=data255[:,300,index])
The following code adds a “/bokeh/dashboard/” url to the bokeh-server. This
URL will render this dashboard app. If you don’t want to serve this
applet from a Bokeh server (for instance if you are embedding in a separate
Flask application), then just remove this block of code.
@bokeh_app.route(“/bokeh/dashboard/”)
@object_page(“dashboard”)
def make_dashboard():
app = Dashboard.create()
return app
``
On Saturday, August 15, 2015 at 5:12:11 AM UTC-4, Sarah Bird wrote:
Hi Michael,
It’s a bit hard to know what’s going on without any error messages. Can you post anything from the console or the command line? Or, give your complete code example.
Also with regard to server stuff, did you see Bryan’s post on it’s current status/future: https://groups.google.com/a/continuum.io/d/msg/bokeh/LORmlhbVqR0/ryzcsF0tDgAJ
Sincerely,
Sarah Bird
On Thursday, August 13, 2015 at 6:30:27 PM UTC+2, Michael wrote:
Hi,
I am modifying the sliders applet (https://github.com/bokeh/bokeh/tree/master/examples/app/sliders_applet) to instead plot an image slice of a set of images stacked in a 3D numpy array. I create the 3D “images” array at the top of the file, outside of the SlidersApp class (i.e. images is global). Here are the basic modifications I made:
In def create(cls):
obj.source = ColumnDataSource(data=dict(image=))
obj.time = Slider(
title=“Time”, name=‘time’,
value=0, start=0, end=data255.shape[-1]-1,step=1
)
plot = figure(height = 600, width = 400, x_range=[0,1], y_range=[0,1])
obj.plot = plot.image(‘image’,source=obj.source,x=[0],y=[0],dw=[1],dh=[1],palette=pal)
``
In def update_data(self):
index = self.time.value
``
self.source.data = dict(image=[data255[…,index]])
``
``
I run bokeh-server --scripy slider_app_mod.py, and the page generates, but the image never shows. I tested the ColumnDataSource and image setup in a simplified code, using output_file, and the image shows fine. I tried modifying my modified slider_app.py to use instead a line plot like the usual slider app, and it works fine.
Any ideas what I’m doing wrong? May be a bug, just wanted to check before I submit a github issue.
Michael
