I have 2 linked plots, so they zoom and pan together.
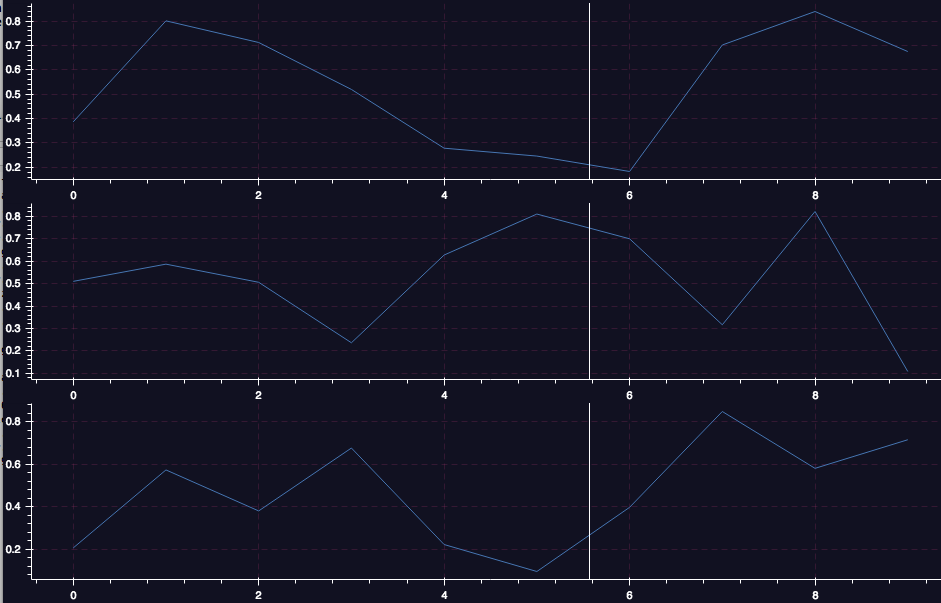
I would like to show a vertical line based on mouse position (the green one in the attached image) on both of them.
Is there an example of this somewhere?
Thank you in advance
I have 2 linked plots, so they zoom and pan together.
I would like to show a vertical line based on mouse position (the green one in the attached image) on both of them.
Is there an example of this somewhere?
Thank you in advance
Hi Alessandro,
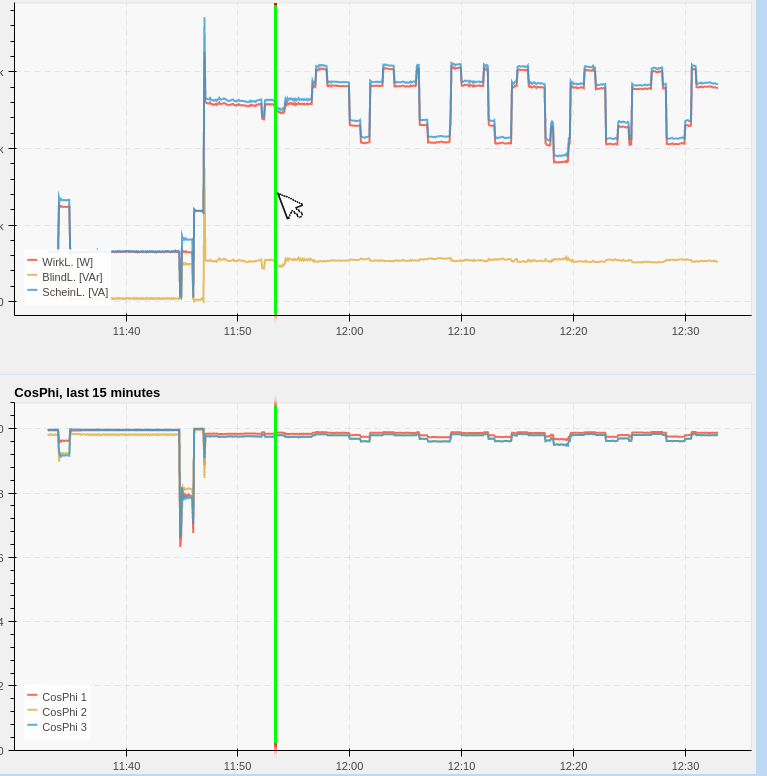
I have multiple plots with the same time-axis (x) but with a
specific offset between the different plots.
And I needed a tool to inspect data in the different plots.
I used a simple segment
()
to draw a vertical line on each plot.
Added a DataSource and use it as source of the segment in all
plots.
To get the the mouse-position data I use the HoverTool
()
and define a callback, that is updating the datasource.
Here are some codesnippets that could be useful. (The tool was
implemented 1 year ago. I think some syntax have to be changed!!!)
# Define a DataSource
data = dict(x=[0]*n_plots)
line_source = ColumnDataSource(data=data)
js = '''
var geometry = cb_data['geometry'];
$.each(poi_time_shift, function(key, value){
  line_source.data[key] = [geometry.x];
});
line_source.trigger('change');
'''
# Add a segment to the plot
for plot in plots:
  plot.segment(x0='x', y0=0, x1='x', y1=2000, line_width=1,
source=line_source)
  hover = HoverTool(tooltips=None, point_policy='follow_mouse',
callback=CustomJS(code=js, args={'line_source': line_source}))
Hope this helps.
http://bokeh.pydata.org/en/latest/docs/reference/models/glyphs/segment.html
http://bokeh.pydata.org/en/latest/docs/reference/models/tools.html#bokeh.models.tools.HoverTool
On 2017-09-13 14:48, Alessandro
Pocaterra wrote:
I have 2 linked plots, so they zoom and pantogether.
I would like to show a vertical line based on mouseposition (the green one in the attached image) on both of
them.Is there an example of this somewhere?
Thank you in advance
–
You received this message because you are subscribed to the GoogleGroups “Bokeh Discussion - Public” group.
To unsubscribe from this group and stop receiving emails from it,send an email to [email protected].
  To post to this group, send email to [email protected].

  To view this discussion on the web visit [https://groups.google.com/a/continuum.io/d/msgid/bokeh/de943630-1950-48ab-acb6-ce77c30ecca2%40continuum.io](https://groups.google.com/a/continuum.io/d/msgid/bokeh/de943630-1950-48ab-acb6-ce77c30ecca2%40continuum.io?utm_medium=email&utm_source=footer).

  For more options, visit [https://groups.google.com/a/continuum.io/d/optout](https://groups.google.com/a/continuum.io/d/optout).
Small working example attached.
cross_hair.py (1.21 KB)
On 2017-09-13 15:39, Web Busino wrote:
Hi Alessandro,
I have multiple plots with the same time-axis (x) but with aspecific offset between the different plots.
And I needed a tool to inspect data in the different plots.I used a simple segment ()to draw a vertical line on each plot.
Added a DataSource and use it as source of the segment in all
plots.
To get the the mouse-position data I use the HoverTool ()
and define a callback, that is updating the datasource.
Here are some codesnippets that could be useful. (The tool was
implemented 1 year ago. I think some syntax have to be
changed!!!)# Define a DataSource data = dict(x=[0]*n_plots) line_source = ColumnDataSource(data=data) js = ''' var geometry = cb_data['geometry']; $.each(poi_time_shift, function(key, value){ line_source.data[key] = [geometry.x]; }); line_source.trigger('change'); ''' # Add a segment to the plot for plot in plots: plot.segment(x0='x', y0=0, x1='x', y1=2000, line_width=1, source=line_source) hover = HoverTool(tooltips=None, point_policy='follow_mouse', callback=CustomJS(code=js, args={'line_source': line_source}))Hope this helps.
-- You received this message because you are subscribed to the GoogleGroups “Bokeh Discussion - Public” group.
To unsubscribe from this group and stop receiving emails from it,
send an email to .
To post to this group, send email to .
To view this discussion on the web visit .
For more options, visit .
http://bokeh.pydata.org/en/latest/docs/reference/models/glyphs/segment.html
http://bokeh.pydata.org/en/latest/docs/reference/models/tools.html#bokeh.models.tools.HoverTool
On 2017-09-13 14:48, Alessandro
Pocaterra wrote:
I have 2 linked plots, so they zoom and pantogether.
I would like to show a vertical line based on mouseposition (the green one in the attached image) on both of
them.Is there an example of this somewhere?
Thank you in advance
–
You received this message because you are subscribed to theGoogle Groups “Bokeh Discussion - Public” group.
To unsubscribe from this group and stop receiving emails fromit, send an email to [email protected].
    To post to this group, send email to [email protected].

    To view this discussion on the web visit [https://groups.google.com/a/continuum.io/d/msgid/bokeh/de943630-1950-48ab-acb6-ce77c30ecca2%40continuum.io](https://groups.google.com/a/continuum.io/d/msgid/bokeh/de943630-1950-48ab-acb6-ce77c30ecca2%40continuum.io?utm_medium=email&utm_source=footer).

    For more options, visit [https://groups.google.com/a/continuum.io/d/optout](https://groups.google.com/a/continuum.io/d/optout).
[email protected]
[email protected]
https://groups.google.com/a/continuum.io/d/msgid/bokeh/28cfed7c-cdad-4f55-4e27-a874d7a18c43%40busino.ch
https://groups.google.com/a/continuum.io/d/optout
Thank you very much Raffs!
My knowledge of JS is almost null and I would not have found a solution like this.
I abuse your kindness with another question about your example: is there a way to recognize when the mouse enters/exits a plot to make the vertical line appear/disappear?
Open the example provided and check the js-console (ff F12).
In the log you see the x values of the geometry. If the mouse
leaves the plot canvas the value becomes Infinity.
Perhaps you can check for this value and hide the line.
On 2017-09-14 09:04, Alessandro
Pocaterra wrote:
Thank you very much Raffs!
My knowledge of JS is almost null and I would not have found asolution like this.
I abuse your kindness with another question about your example:is there a way to recognize when the mouse enters/exits a plot
to make the vertical line appear/disappear?
–
You received this message because you are subscribed to the GoogleGroups “Bokeh Discussion - Public” group.
To unsubscribe from this group and stop receiving emails from it,send an email to [email protected].
  To post to this group, send email to [email protected].

  To view this discussion on the web visit [https://groups.google.com/a/continuum.io/d/msgid/bokeh/6fc248f8-181b-4c2c-82c0-86011fbdf52a%40continuum.io](https://groups.google.com/a/continuum.io/d/msgid/bokeh/6fc248f8-181b-4c2c-82c0-86011fbdf52a%40continuum.io?utm_medium=email&utm_source=footer).

  For more options, visit [https://groups.google.com/a/continuum.io/d/optout](https://groups.google.com/a/continuum.io/d/optout).
Hello,
This code is working great for me to get linked hover line segments between my Bokeh plot panels.
However, I have a slight problem I’m hoping to get some input on:
I am plotting timeseries data and defaulting to hourly data points for a 24-hr period. I have a Date Range Slider widget hooked up to change the x-axis date range to 7 days.
With the hover line segments working, if I use the slider to change to a 7 day view and then hover the mouse back over the plot, the x-range snaps back to the original 24-hr date range.
This action is a result of adding the code for linked line segments.
Is there a way to update the x-range of the vertical line segments in the hover tool when I have action on the Date Range Slider?
I am happy to include any snippets of relevant code, but for now I thought I would just gather any ideas…
My Bokeh app (with the date range slider widget) can be viewed here:
http://www.snowpacktracker.com/btac/stormtracker/tetons
Thanks much!
–Patrick
On Wednesday, September 13, 2017 at 6:48:03 AM UTC-6, Alessandro Pocaterra wrote:
I have 2 linked plots, so they zoom and pan together.
I would like to show a vertical line based on mouse position (the green one in the attached image) on both of them.
Is there an example of this somewhere?
Thank you in advance
Could you try if this is working for you?
On Monday, February 25, 2019 at 4:15:14 AM UTC+1, Patrick Wright wrote:
Hello,
This code is working great for me to get linked hover line segments between my Bokeh plot panels.
However, I have a slight problem I’m hoping to get some input on:
I am plotting timeseries data and defaulting to hourly data points for a 24-hr period. I have a Date Range Slider widget hooked up to change the x-axis date range to 7 days.
With the hover line segments working, if I use the slider to change to a 7 day view and then hover the mouse back over the plot, the x-range snaps back to the original 24-hr date range.
This action is a result of adding the code for linked line segments.
Is there a way to update the x-range of the vertical line segments in the hover tool when I have action on the Date Range Slider?
I am happy to include any snippets of relevant code, but for now I thought I would just gather any ideas…
My Bokeh app (with the date range slider widget) can be viewed here:
Thanks much!
–Patrick
On Wednesday, September 13, 2017 at 6:48:03 AM UTC-6, Alessandro Pocaterra wrote:
I have 2 linked plots, so they zoom and pan together.
I would like to show a vertical line based on mouse position (the green one in the attached image) on both of them.
Is there an example of this somewhere?
Thank you in advance
Tony,
Yes this is working for single figures, but the Crosshair tool only displays in one figure at a time (not linked across figures).
On Monday, February 25, 2019 at 6:38:18 PM UTC-7, tony halik wrote:
Could you try if this is working for you?
On Monday, February 25, 2019 at 4:15:14 AM UTC+1, Patrick Wright wrote:
Hello,
This code is working great for me to get linked hover line segments between my Bokeh plot panels.
However, I have a slight problem I’m hoping to get some input on:
I am plotting timeseries data and defaulting to hourly data points for a 24-hr period. I have a Date Range Slider widget hooked up to change the x-axis date range to 7 days.
With the hover line segments working, if I use the slider to change to a 7 day view and then hover the mouse back over the plot, the x-range snaps back to the original 24-hr date range.
This action is a result of adding the code for linked line segments.
Is there a way to update the x-range of the vertical line segments in the hover tool when I have action on the Date Range Slider?
I am happy to include any snippets of relevant code, but for now I thought I would just gather any ideas…
My Bokeh app (with the date range slider widget) can be viewed here:
Thanks much!
–Patrick
On Wednesday, September 13, 2017 at 6:48:03 AM UTC-6, Alessandro Pocaterra wrote:
I have 2 linked plots, so they zoom and pan together.
I would like to show a vertical line based on mouse position (the green one in the attached image) on both of them.
Is there an example of this somewhere?
Thank you in advance
For Bokeh 1.0.4 it should work for all figures. Make sure you don’t include your own ‘crosshair’ in the figure constructor. Just put all plots in an plots array and call the function addLinkedCrosshairs(plots).
On Tuesday, February 26, 2019 at 3:40:41 PM UTC+1, Patrick Wright wrote:
Tony,
Yes this is working for single figures, but the Crosshair tool only displays in one figure at a time (not linked across figures).
On Monday, February 25, 2019 at 6:38:18 PM UTC-7, tony halik wrote:
Could you try if this is working for you?
On Monday, February 25, 2019 at 4:15:14 AM UTC+1, Patrick Wright wrote:
Hello,
This code is working great for me to get linked hover line segments between my Bokeh plot panels.
However, I have a slight problem I’m hoping to get some input on:
I am plotting timeseries data and defaulting to hourly data points for a 24-hr period. I have a Date Range Slider widget hooked up to change the x-axis date range to 7 days.
With the hover line segments working, if I use the slider to change to a 7 day view and then hover the mouse back over the plot, the x-range snaps back to the original 24-hr date range.
This action is a result of adding the code for linked line segments.
Is there a way to update the x-range of the vertical line segments in the hover tool when I have action on the Date Range Slider?
I am happy to include any snippets of relevant code, but for now I thought I would just gather any ideas…
My Bokeh app (with the date range slider widget) can be viewed here:
Thanks much!
–Patrick
On Wednesday, September 13, 2017 at 6:48:03 AM UTC-6, Alessandro Pocaterra wrote:
I have 2 linked plots, so they zoom and pan together.
I would like to show a vertical line based on mouse position (the green one in the attached image) on both of them.
Is there an example of this somewhere?
Thank you in advance
However, if I use your code except replace the ‘js_move’ and ‘js_leave’ using the js code from the first answer on this SO post, it works. Thanks!
On Tuesday, February 26, 2019 at 7:40:41 AM UTC-7, Patrick Wright wrote:
Tony,
Yes this is working for single figures, but the Crosshair tool only displays in one figure at a time (not linked across figures).
On Monday, February 25, 2019 at 6:38:18 PM UTC-7, tony halik wrote:
Could you try if this is working for you?
On Monday, February 25, 2019 at 4:15:14 AM UTC+1, Patrick Wright wrote:
Hello,
This code is working great for me to get linked hover line segments between my Bokeh plot panels.
However, I have a slight problem I’m hoping to get some input on:
I am plotting timeseries data and defaulting to hourly data points for a 24-hr period. I have a Date Range Slider widget hooked up to change the x-axis date range to 7 days.
With the hover line segments working, if I use the slider to change to a 7 day view and then hover the mouse back over the plot, the x-range snaps back to the original 24-hr date range.
This action is a result of adding the code for linked line segments.
Is there a way to update the x-range of the vertical line segments in the hover tool when I have action on the Date Range Slider?
I am happy to include any snippets of relevant code, but for now I thought I would just gather any ideas…
My Bokeh app (with the date range slider widget) can be viewed here:
Thanks much!
–Patrick
On Wednesday, September 13, 2017 at 6:48:03 AM UTC-6, Alessandro Pocaterra wrote:
I have 2 linked plots, so they zoom and pan together.
I would like to show a vertical line based on mouse position (the green one in the attached image) on both of them.
Is there an example of this somewhere?
Thank you in advance