Hi !
I am using Bokeh 2.3.0.
I have several dataframes containing X,Y and date columns and I would like each X/Y/date to appear when hovering the points.
This could be achieved with multiple lines instead, but for my application the number of lines depends of user input, so updating the multi_line source seems better.
So far I have defined tooltips as usual with lines, quads, etc…
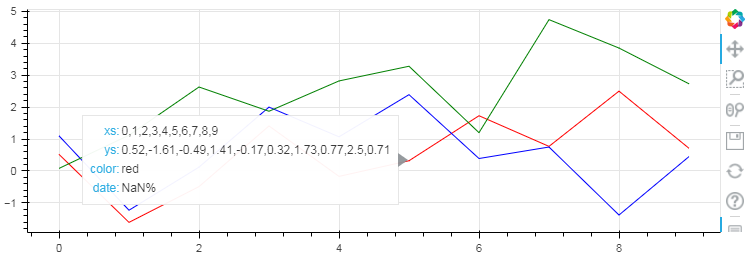
What I get in tooltips are the arrays making up each line (picture below).
Is there any way to get access pointwise values instead of line arrays and still apply formatting ?
Thanks in advance for your help !
import pandas as pd
import numpy as np
from bokeh.io import show
from bokeh.plotting import figure
from bokeh.models import ColumnDataSource, HoverTool

xs = [np.arange(0,10) for _ in range(3)]
ys = [(np.random.randn(10) + i).round(2) for i in range(3)]
dates = [pd.date_range("2021-01-01", "2021-01-10") for _ in range(3)]
colors = ["red", "blue", "green"]
source = ColumnDataSource(dict(xs=xs, ys=ys, dates=dates, colors=colors))

p = figure(plot_width=)
p.multi_line(xs="xs", ys="ys", color="colors", source=source)
p.add_tools(HoverTool(tooltips=[("xs","@xs"), ("ys","@ys"), ("color", "@colors"), ("date","@dates{%F}")]))

show(p)