Hey,
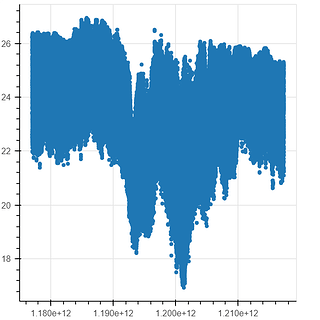
i tried to visualize a netCDF Datasource but i cant get the transformation from xarray via pandad to bokeh datasource to work. The different dimensions are turned into a MultiIndex Column and i cant figure out how to use parts of this column with bokeh.
Here are parts of my code. Do you have any examples for me?
from bokeh.plotting import figure, output_file, show
from bokeh.models import ColumnDataSource
import pandas
import xarray as xr
first = xr.open_dataset("/home/max/Downloads/OS_NTAS_2007_D_T30min.nc")
df =first.to_dataframe()
df.drop(columns=[“INST_MFGR”,“INST_MODEL”,“INST_SN”], inplace=True)
Dropping those columns because they contain Strings: b’INST_123’
src = ColumnDataSource(df)
print(src.column_names)
# OUT: ['INST', 'TEMP', 'DEPTH_LATITUDE_LONGITUDE_TIME']
p = figure(plot_width=400, plot_height=400)
p.circle(x=‘TIME’, y=‘TEMP’, source=src)
ERROR:bokeh.core.validation.check:E-1001 (BAD_COLUMN_NAME): Glyph refers to nonexistent column name: TIME [renderer: GlyphRenderer(id=‘1039’, …)]
show the results
show(p)
``
You can do this:
df =first.to_dataframe().reset_index()
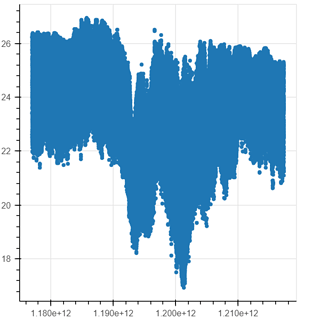
and it will produce:
···
Le dimanche 25 novembre 2018 04:37:50 UTC+1, [email protected] a écrit :
Hey,
i tried to visualize a netCDF Datasource but i cant get the transformation from xarray via pandad to bokeh datasource to work. The different dimensions are turned into a MultiIndex Column and i cant figure out how to use parts of this column with bokeh.
Here are parts of my code. Do you have any examples for me?
from bokeh.plotting import figure, output_file, show
from bokeh.models import ColumnDataSource
import pandas
import xarray as xr
first = xr.open_dataset(“/home/max/Downloads/OS_NTAS_2007_D_T30min.nc”)
df =first.to_dataframe()
df.drop(columns=[“INST_MFGR”,“INST_MODEL”,“INST_SN”], inplace=True)
Dropping those columns because they contain Strings: b’INST_123’
src = ColumnDataSource(df)
print(src.column_names)
# OUT: ['INST', 'TEMP', 'DEPTH_LATITUDE_LONGITUDE_TIME']
p = figure(plot_width=400, plot_height=400)
p.circle(x=‘TIME’, y=‘TEMP’, source=src)
ERROR:bokeh.core.validation.check:E-1001 (BAD_COLUMN_NAME): Glyph refers to nonexistent column name: TIME [renderer: GlyphRenderer(id=‘1039’, …)]
show the results
show(p)
``
Hey, that works! Thank you!
···
Am Sonntag, 25. November 2018 21:11:53 UTC+1 schrieb Xavier Artusi:
You can do this:
df =first.to_dataframe().reset_index()
and it will produce:
Le dimanche 25 novembre 2018 04:37:50 UTC+1, [email protected] a écrit :
Hey,
i tried to visualize a netCDF Datasource but i cant get the transformation from xarray via pandad to bokeh datasource to work. The different dimensions are turned into a MultiIndex Column and i cant figure out how to use parts of this column with bokeh.
Here are parts of my code. Do you have any examples for me?
from bokeh.plotting import figure, output_file, show
from bokeh.models import ColumnDataSource
import pandas
import xarray as xr
first = xr.open_dataset(“/home/max/Downloads/OS_NTAS_2007_D_T30min.nc”)
df =first.to_dataframe()
df.drop(columns=[“INST_MFGR”,“INST_MODEL”,“INST_SN”], inplace=True)
Dropping those columns because they contain Strings: b’INST_123’
src = ColumnDataSource(df)
print(src.column_names)
# OUT: ['INST', 'TEMP', 'DEPTH_LATITUDE_LONGITUDE_TIME']
p = figure(plot_width=400, plot_height=400)
p.circle(x=‘TIME’, y=‘TEMP’, source=src)
ERROR:bokeh.core.validation.check:E-1001 (BAD_COLUMN_NAME): Glyph refers to nonexistent column name: TIME [renderer: GlyphRenderer(id=‘1039’, …)]
show the results
show(p)
``

