A few weeks ago, I asked this question about making a particular graph, and I got very good advice from @carolyn and @Bryan. My apologies for not saying thanks then - your help was very much appreciated!
Here’s what I have so far:
import bokeh.io
from bokeh.plotting import gridplot, figure, output_file, show, output_notebook
from bokeh.models import ColumnDataSource, BoxAnnotation, CategoricalAxis, FactorRange
from bokeh.embed import components

x = ['label1','label2','label3','label4','label5','label6','label7', 'Trying for a multiline label']
y = [1.0, 2.7, 1.2, 4.5, 1.5, 2.2, 1.8, 4.6]
p = figure(x_range=[*x], y_range=(0, 5), plot_height=400, plot_width=550)
dots = p.circle(x=x, y=y, color='black',size=10)
line = p.line(x=x, y=y, color='black')

numbers = [str(x) for x in y]
p.extra_x_ranges = {"extra_numbers": FactorRange(factors=numbers)}
p.add_layout(CategoricalAxis(x_range_name="extra_numbers"), 'below')
p.title.text = 'Plot'
p.title.text_font_size = "25px"
p.title.text_color = "black"
p.title.align = "center"

low_box = BoxAnnotation(top=2, fill_alpha=0.1, fill_color='green')
mid_box = BoxAnnotation(bottom=2, top=3, fill_alpha=0.1, fill_color='orange')
high_box = BoxAnnotation(bottom=3, fill_alpha=0.1, fill_color='red')

p.add_layout(low_box)
p.add_layout(mid_box)
p.add_layout(high_box)

show(p)
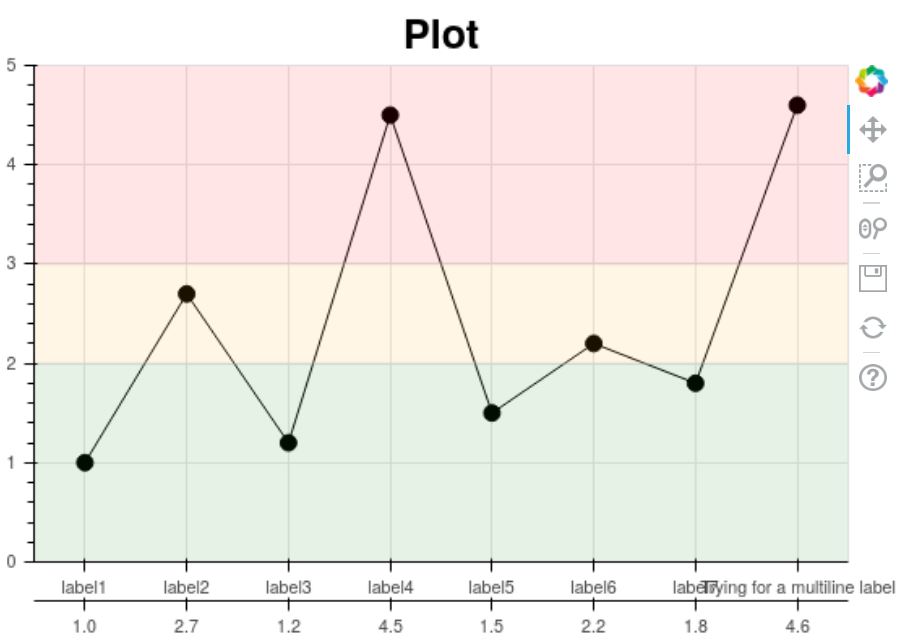
I think I’m almost at what I need, except that I have not managed to figure out multi-line axis labels. Is there an easy way to do this? The best method I came up with was trying to use vertical labels, but as you can see, they don’t look very nice, and mess up the second axis below the text:
from bokeh.models import CategoricalAxis, FactorRange
from bokeh.plotting import figure, show
from math import pi

x = ['label1','label2','label3','label4','label5','label6','label7', 'Trying for a multiline label']
y = [1.0, 2.7, 1.2, 4.5, 1.5, 2.2, 1.8, 4.6]
p = figure(x_range=[*x], y_range=(0, 5), plot_height=900)
dots = p.circle(x=x, y=y, color='black',size=10)
line = p.line(x=x, y=y, color='black')
p.xaxis.major_label_orientation = pi/2
p.xaxis.major_label_text_font_size = "1.4em"

p.xaxis.axis_line_width = 2
p.yaxis.axis_line_width = 2
numbers = [str(x) for x in y]
p.extra_x_ranges = {"extra_numbers": FactorRange(factors=numbers)}
p.add_layout(CategoricalAxis(x_range_name="extra_numbers"), 'below')
show(p)
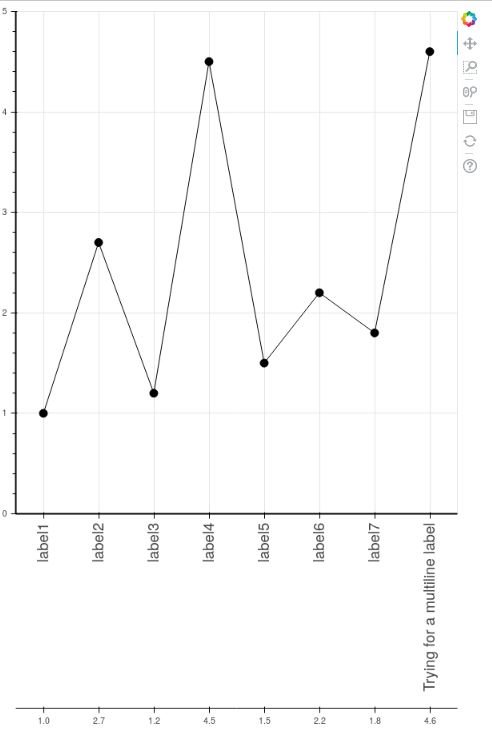
Another minor question is whether or not it is possible to remove the line and demarcations above the numbers on the second axis.
I’m sure this is a simple problem that has a solution I haven’t figured out yet. I apologize if any of my requests are unclear; I can definitely clarify if needed.
Any solutions or advice would be greatly appreciated!