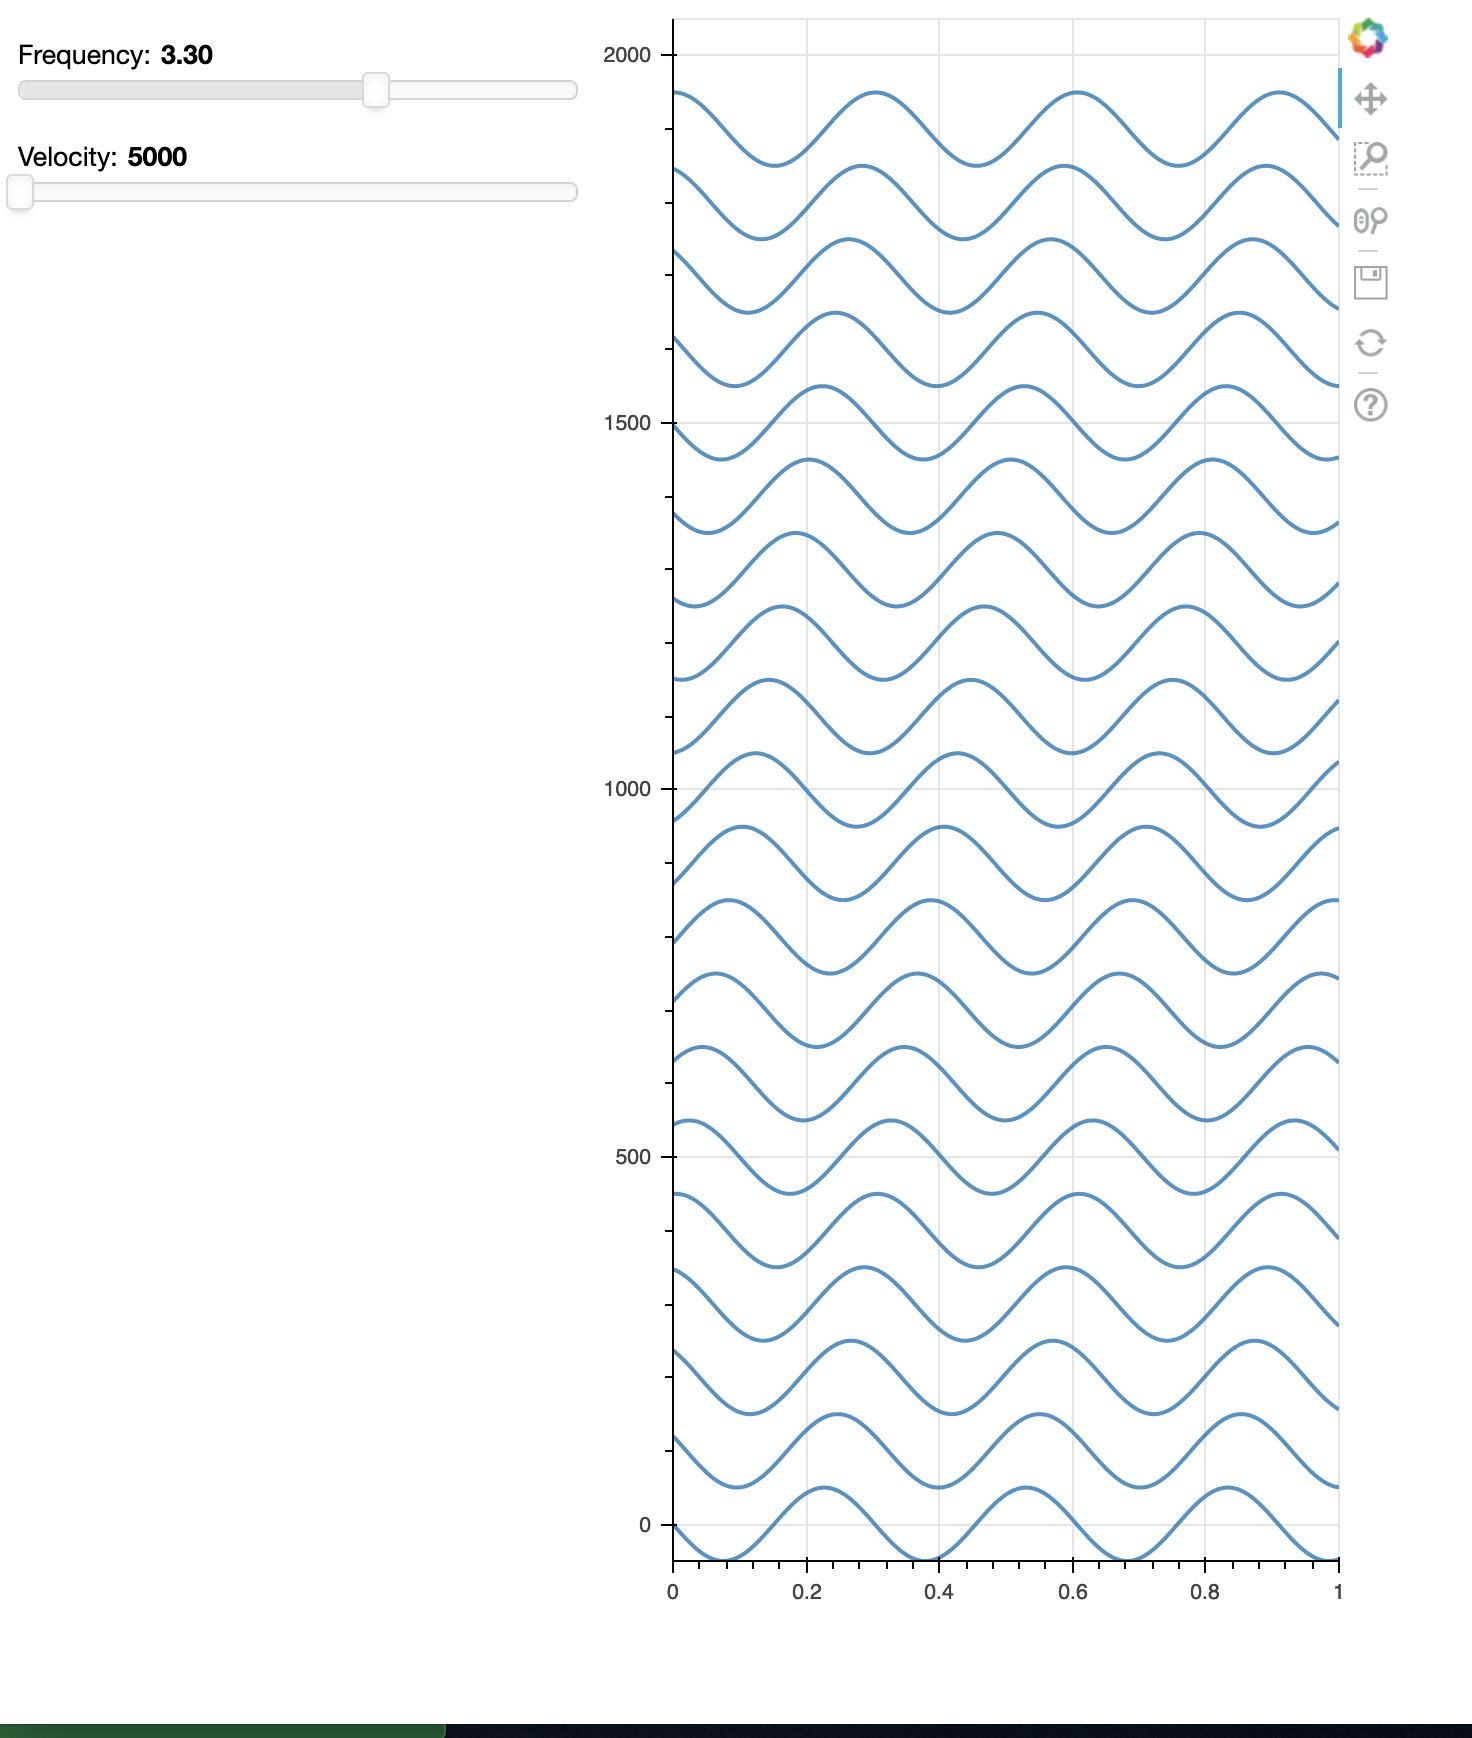
Folks, to draw attached, I have to coerce each line with an offset and a scale appropriate to the offset. Is there a way to move the line without rescaling and adding a dc offset?
The y list of sine waves has to be scaled by dx and a dc offset of dx*i added. Would be great to just keep y as sine waves and then
tell the plotting tool (“multi_line” for example) dx=1 or whatever…
Thanks,
Sridhar
set up data
N = 1000
dt = 0.001
Ntrc = 20
dx = 100
v0=5000
f0 = 3
k0 = f0/v0
time and y(t) for Ntrc sine waves
t = [np.linspace(0, 1, N) for i in np.arange(Ntrc)]
y = [(dx/2)np.sin(2 * np.pi * (k0 * dx * i - f0 * t[0])) + dxi for i in np.arange(Ntrc)]