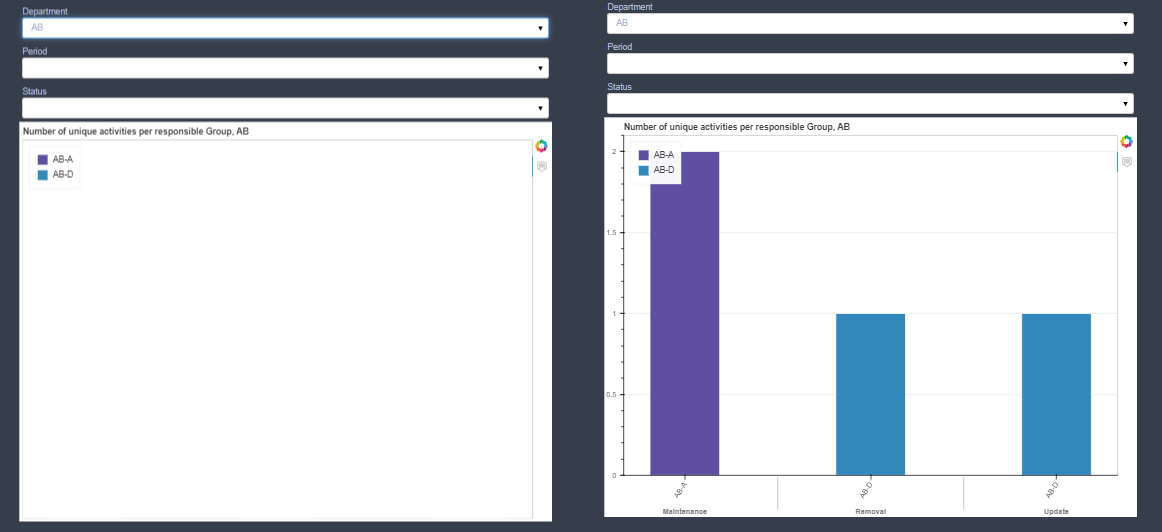
Hello! I have a problem when I try to generate and display plots based on multiple dropdowns. The code almost works, because it selects the right plot (which has the right title and the legend with the right number of “Resp. Groups” per Department) but the plot is empty.
If I skip the part where I put visible = False to all plots except one when I generate the plots, everything works. But the problem is then that I display all the plots the first time I run the code (and after they are all hidden except one, as soon as I make a selection in on of the dropdowns). With my real data this will not work because I have hundreds of plots.
When I add some console.log outputs in the JS and check the name of the child, the str4, the visibility of the child etc. in the console of the page source, it all looks correct and the visibility is true. But when I check the visibility of the same plot that is beeing displayed in another cell, the plot is visible = False.
I am a beginner with both Python and Bokeh so I apologize that my code is not very efficient or clever.
Thank you so very much for any comments and help!
#Code that Creates the DFs and the corresponding plots
list_of_dfs = []
list_figure_names = []

data = {'Department': ['IN', 'IN', 'IN', 'AB', 'AB', 'AB', 'AB', 'YT', 'YT', 'YT'],
        'ID': ['3001', '3002', '3003', '3004', '3005', '3006', '3007', '3008', '3009', '30010'],
        'Resp. Group': ['IN-B', 'IN-C', 'IN-C', 'AB-A', 'AB-A', 'AB-D', 'AB-D', 'YT-M', 'YT-M', 'YT-K'],
        'Period': ['2023', '2023', '2024', '2023', '2025', '2023', '2025', '2026', '2024', '2024'],
        'Status': ['Created', 'Under_Approval', 'Under_Approval', 'Under_Approval', 'Finished', 'Created', 'Created', 'Finshied', 'Under_Approval', 'Finished'],
        'Project': ['Maintenance', 'Removal', 'Update', 'Maintenance', 'Maintenance', 'Update', 'Removal', 'Removal', 'Maintenance', 'Update']
       }

report_activities = pd.DataFrame(data)


def clean_df_act_per(dep, per, stat):
    df = dep + per + stat
    globals()[df] = report_activities[['Department', 'ID', 'Resp. Group', 'Period', 'Status', 'Project']]
    globals()[df] = globals()[df].loc[globals()[df]['Department'].str.startswith(dep, na=False)]
    globals()[df] = globals()[df].loc[globals()[df]['Period'].astype(str).str.endswith(per, na=False)]
    globals()[df] = globals()[df].loc[globals()[df]['Status'].str.endswith(stat, na=False)]
    globals()[df] = globals()[df].groupby(['Resp. Group', 'Project'], as_index=False)['ID'].nunique()
    list_figure_names.append(df)
    list_of_dfs.append(globals()[df])


list_dep = ['', 'IN', 'AB', 'YT']
list_per = ['', '2023', '2024', '2025', '2026']
list_stat = ['', 'Created', 'Under_Approval','Finished']

for a in list_dep:
    for b in list_per:
        for c in list_stat:
            clean_df_act_per(a, b, c)

list_figures = []
def plot_bar_time_act(df, inp, name, vis):
    df['x'] = df[['Project', 'Resp. Group']].apply(lambda x: (x[0],str(x[1])), axis=1)
    globals()[inp] = figure(name=name, x_range=FactorRange(*list(df['x'])), width=800,
                           title="Number of unique activities per responsible Group, {}".format(name),
                           tools=[HoverTool()], tooltips="@x: @ID")
    globals()[inp].vbar(
        x="x",
        top="ID",
        width=0.9,
        source=df,
        line_color="white",
        legend_group='Resp. Group',
        fill_color=factor_cmap('x', palette=YlGn198, factors=df['Resp. Group'], start=1, end=4)
    )
    globals()[inp].y_range.start = 0
    globals()[inp].x_range.range_padding = 0.1
    globals()[inp].xaxis.major_label_orientation = 1
    globals()[inp].xgrid.grid_line_color = None
    globals()[inp].legend.location = "top_left"
    globals()[inp].legend.orientation = "vertical"
    list_figures.append(globals()[inp])
    if vis == 'Yes':
        globals()[inp].visible = True
    else:
        globals()[inp].visible = False

list_vis = ['No'] * len(list_of_dfs)
list_vis.insert(0, 'Yes')
list_figure_names_p = list(map(lambda ls: 'p_'+ls, list_figure_names))

for (a, b, c, d) in zip(list_of_dfs, list_figure_names_p, list_figure_names, list_vis):
     plot_bar_time_act(a, b, c, d)
#Showing the plots and three dropdowns

select1 = Select(title='Department', options=list_dep, value='')
select2 = Select(title='Period', options=list_per, value='')
select3 = Select(title='Status', options=list_stat, value='')

col = column(list_figures)

select1.js_on_change('value', CustomJS(args=dict(s1=select1, s2=select2, s3=select3, col=col
), code="""
    for (const plot of col.children) {
        plot.visible = false
    }
    let str1 = s1.value;
    let str2 = s2.value;
    let str3 = s3.value;
    let str4 = str1.concat(str2, str3);
    for (const child of col.children) {
        child.visible = (child.name == str4)
    }
"""))

select2.js_on_change('value', CustomJS(args=dict(s1=select1, s2=select2, s3=select3, col=col
), code="""
    for (const plot of col.children) {
        plot.visible = false
    }
    let str1 = s1.value;
    let str2 = s2.value;
    let str3 = s3.value;
    let str4 = str1.concat(str2, str3);
    for (const child of col.children) {
        child.visible = (child.name == str4)
    }
"""))

select3.js_on_change('value', CustomJS(args=dict(s1=select1, s2=select2, s3=select3, col=col
), code="""
    for (const plot of col.children) {
        plot.visible = false
    }
    let str1 = s1.value;
    let str2 = s2.value;
    let str3 = s3.value;
    let str4 = str1.concat(str2, str3);
    for (const child of col.children) {
        child.visible = (child.name == str4)
    }
"""))

layout = widgetbox(select1, select2, select3, col)
show(layout)
This is how the plot locks vs. how I want it to look.