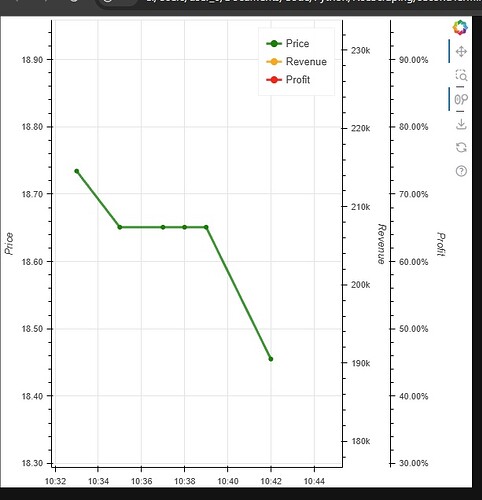
Multiple Lines not rendering (despite common X_range)
CODE
from bokeh.models import Range1d, LinearAxis, NumeralTickFormatter, DatetimeTickFormatter, ColumnDataSource

import pandas as pd

data_1 = [
    ('1900-01-01 10:33:00', 18.7342),
    ('1900-01-01 10:35:00', 18.6508),
    ('1900-01-01 10:37:00', 18.6508),
    ('1900-01-01 10:38:00', 18.6508),
    ('1900-01-01 10:39:00', 18.6508),
    ('1900-01-01 10:42:00', 18.4550),
]
df_price = pd.DataFrame(data_1, columns=['Time', 'Price'])


data_0 = [
    ('1900-01-01 10:33:00', 197342, 0.7342),
    ('1900-01-01 10:35:00', 192508, 0.6508),
    ('1900-01-01 10:37:00', 196508, 0.6508),
    ('1900-01-01 10:38:00', 190508, 0.6508),
    ('1900-01-01 10:39:00', 206508, 0.6508),
    ('1900-01-01 10:42:00', 214550, 0.4550),

]

df_0 = pd.DataFrame(data_0, columns=['Time', 'Revenue','Profit'])

plot = figure(x_axis_type='datetime' ,y_axis_label = 'Price')
plot.yaxis[0].formatter = NumeralTickFormatter(format='0.00a')


print(df_price.head(3))
print(df_0.head(3))


# SAME X_RANGE MAINTAINED ACROSS ALL LINES BUT ONLY MAIN Y-AXIS 'PRICE' RENDERS

x_range = pd.to_datetime(df_price['Time'])

plot.line(x=x_range, y=df_price['Price'], line_width=3, line_color="green",
          visible=True, alpha=0.8, muted_color="green", muted_alpha=0.2,
          legend_label='Price')
plot.scatter(x=x_range, y=df_price['Price'], size=5, color="green", legend_label='Price')

plot.line(x=x_range, y=df_0['Revenue'], line_width=3, line_color="orange",
          visible=True, alpha=0.8, muted_color="orange", muted_alpha=0.2,
          legend_label='Revenue')
plot.scatter(x=x_range, y=df_0['Revenue'], size=5, color="orange", legend_label='Revenue')


plot.line(x=x_range, y=df_0['Profit'], line_width=3, line_color="red",
          visible=True, alpha=0.8, muted_color="red", muted_alpha=0.2,
          legend_label='Profit')
plot.scatter(x=x_range, y=df_0['Profit'], size=5, color="red", legend_label='Profit')


plot.x_range.start = min(pd.to_datetime(df_0['Time']))
plot.x_range.end = max(pd.to_datetime(df_0['Time']))
plot.y_range.start = df_price['Price'].min()
plot.y_range.end = df_price['Price'].max()

plot.extra_y_ranges["RevenueAxis"] = Range1d(start= df_0['Revenue'].min() , end=df_0['Revenue'].max())
plot.extra_y_ranges["ProfitAxis"] = Range1d(start= df_0['Profit'].min() , end=df_0['Profit'].max())
RevenueAxis = LinearAxis(y_range_name="RevenueAxis", axis_label="Revenue")
ProfitAxis = LinearAxis(y_range_name="ProfitAxis", axis_label="Profit")
RevenueAxis.formatter = NumeralTickFormatter(format='0a')
ProfitAxis.formatter = NumeralTickFormatter(format='0.00%')
plot.add_layout(RevenueAxis, 'right')
plot.add_layout(ProfitAxis, 'right')
plot.xaxis.formatter = DatetimeTickFormatter(
    minutes="%H:%M",
)
plot.legend.click_policy = "mute"

show(plot)
