Multiple lines' tooltips in vline mode shows only one lines' values

Hi

I am plotting a few columns as lines from a pandas dataframe.

I want to have a vline tooltip showing all the lines’ values @ the current x.

I got it working… mostly…

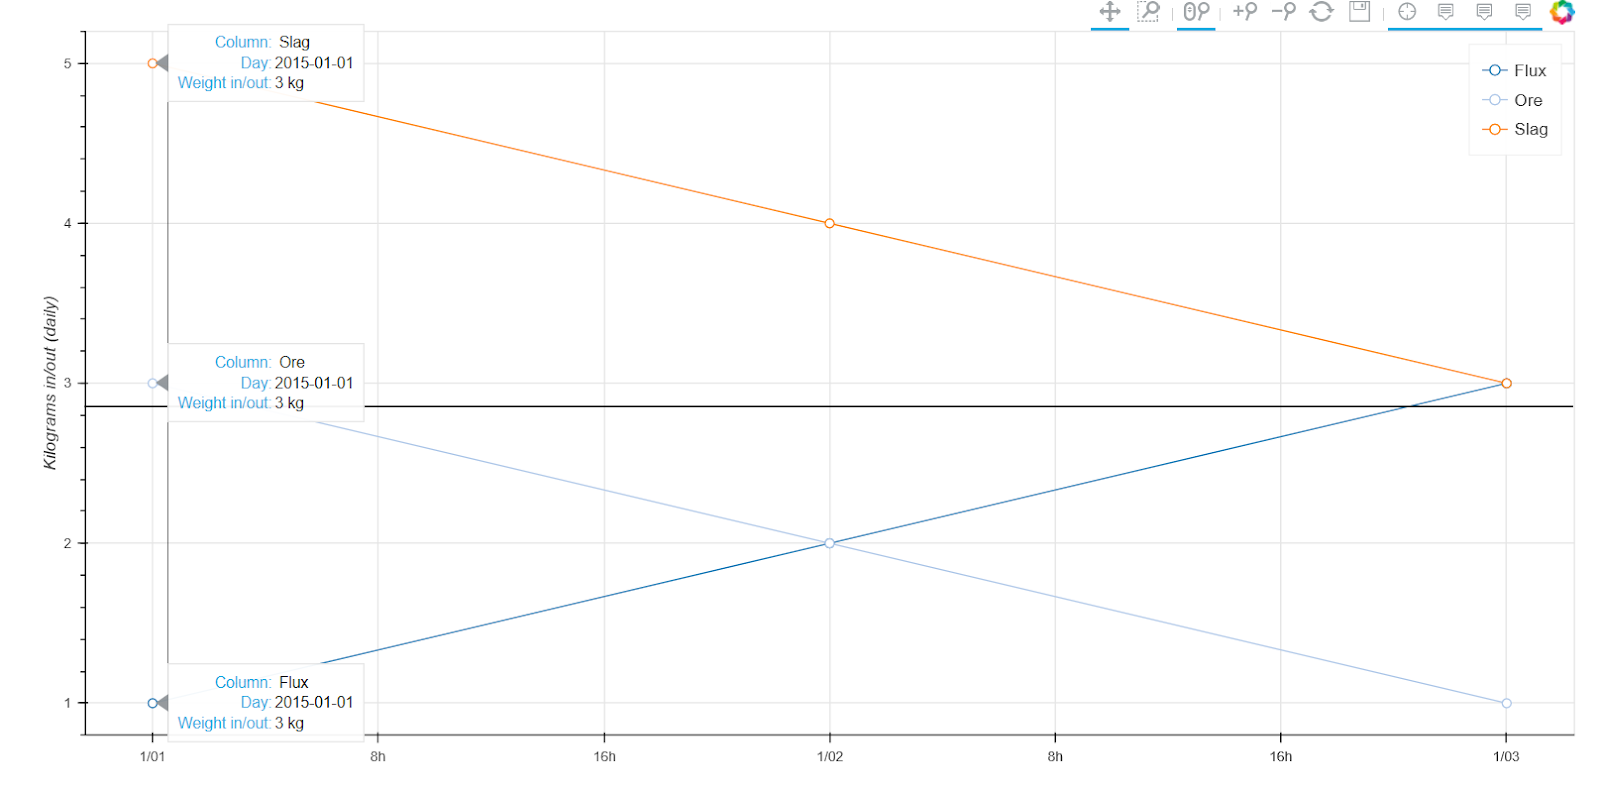
For some reason it shows only the value of closest line’s closest data point at all of the tooltips. Why does it not and how do I get it to show each line’s closest value?

import itertools
import pandas as pd
from bokeh import palettes
from bokeh.models import HoverTool
from bokeh.plotting import figure, show

dummy = pd.DataFrame(
{‘DT’: [‘2015-01-01’, ‘2015-01-02’, ‘2015-01-03’], ‘Flux’: [1, 2, 3], ‘Ore’: [3, 2, 1], ‘Slag’: [5, 4, 3]})
dummy.index = pd.to_datetime(dummy[‘DT’])
dummy.drop(‘DT’, axis=1, inplace=True)

colour generator

def color_gen():
yield from itertools.cycle(palettes.Category20[len(dummy.columns)])

color = color_gen()

TOOLS = “crosshair,pan,wheel_zoom,box_zoom,zoom_in,zoom_out,reset,save”
p = figure(width=1200, height=600, x_axis_type=“datetime”, y_axis_label=‘Kilograms in/out (daily)’,
toolbar_location=“above”, tools=TOOLS, active_scroll=“wheel_zoom”)

for column in dummy.columns:
x, y = dummy.index.values, dummy[column].values
this_color = next(color)

my_plot = p.line(x, y, legend=column, color=this_color)
p.circle(x, y, legend=column, fill_color="white", line_color=this_color, size=7)

p.add_tools(HoverTool(tooltips=[("Column", " %s" % column),
                                ("Day", "$x{%F}"),
                                ("Weight in/out", "$y{0} kg")],
                      formatters={'$x': 'datetime'},
                      mode='vline',
                      renderers=[my_plot]))

show(p)

``

This is the image I get. I expected 5, 3, 1 as tooltips, not 3, 3, 3.
Thats’s quite interesting. Have you tried using ColumnDataSources and referencing them with @ for the hovertool?

A rough example would be:

source1=ColumnDataSource(dict(w1=[5,3,1]))

source2=ColumnDataSource(dict(w2=[3,3,3]))

source3=ColumnDataSource(dict(w3=[1,3,5]))

hover=HoverTool(tooltips=[(“Weight in/out 1”, “@w1”), (“Weight in/out 2”, “@w2”), (“Weight in/out 3”, “@w3”)])

I have omitted the vline, but probably you will come up with the solution you need with a few tweaks.

···

On Monday, February 19, 2018 at 9:06:10 AM UTC-5, Stéphan Taljaard wrote:

Hi

I am plotting a few columns as lines from a pandas dataframe.

I want to have a vline tooltip showing all the lines’ values @ the current x.

I got it working… mostly…

For some reason it shows only the value of closest line’s closest data point at all of the tooltips. Why does it not and how do I get it to show each line’s closest value?

import itertools
import pandas as pd
from bokeh import palettes
from bokeh.models import HoverTool
from bokeh.plotting import figure, show

dummy = pd.DataFrame(
{‘DT’: [‘2015-01-01’, ‘2015-01-02’, ‘2015-01-03’], ‘Flux’: [1, 2, 3], ‘Ore’: [3, 2, 1], ‘Slag’: [5, 4, 3]})
dummy.index = pd.to_datetime(dummy[‘DT’])
dummy.drop(‘DT’, axis=1, inplace=True)

colour generator

def color_gen():
yield from itertools.cycle(palettes.Category20[len(dummy.columns)])

color = color_gen()

TOOLS = “crosshair,pan,wheel_zoom,box_zoom,zoom_in,zoom_out,reset,save”
p = figure(width=1200, height=600, x_axis_type=“datetime”, y_axis_label=‘Kilograms in/out (daily)’,
toolbar_location=“above”, tools=TOOLS, active_scroll=“wheel_zoom”)

for column in dummy.columns:
x, y = dummy.index.values, dummy[column].values
this_color = next(color)

my_plot = p.line(x, y, legend=column, color=this_color)
p.circle(x, y, legend=column, fill_color="white", line_color=this_color, size=7)


p.add_tools(HoverTool(tooltips=[("Column", " %s" % column),
                                ("Day", "$x{%F}"),
                                ("Weight in/out", "$y{0} kg")],
                      formatters={'$x': 'datetime'},
                      mode='vline',
                      renderers=[my_plot]))

show(p)

``

This is the image I get. I expected 5, 3, 1 as tooltips, not 3, 3, 3.