Bokeh's Python API function export_png can grab an entire document in one PNG, including grid plots. Otherwise I think you would have to look at coordinating Selenium and a headless browser to capture an image (which is all export_png does under the covers, anyway).
I can't think of any current way to be able to do this from within the browser, i.e. with a plot tool.
> On Feb 11, 2019, at 10:00, peng wang <[email protected]> wrote:
>
> Hi guys,
>
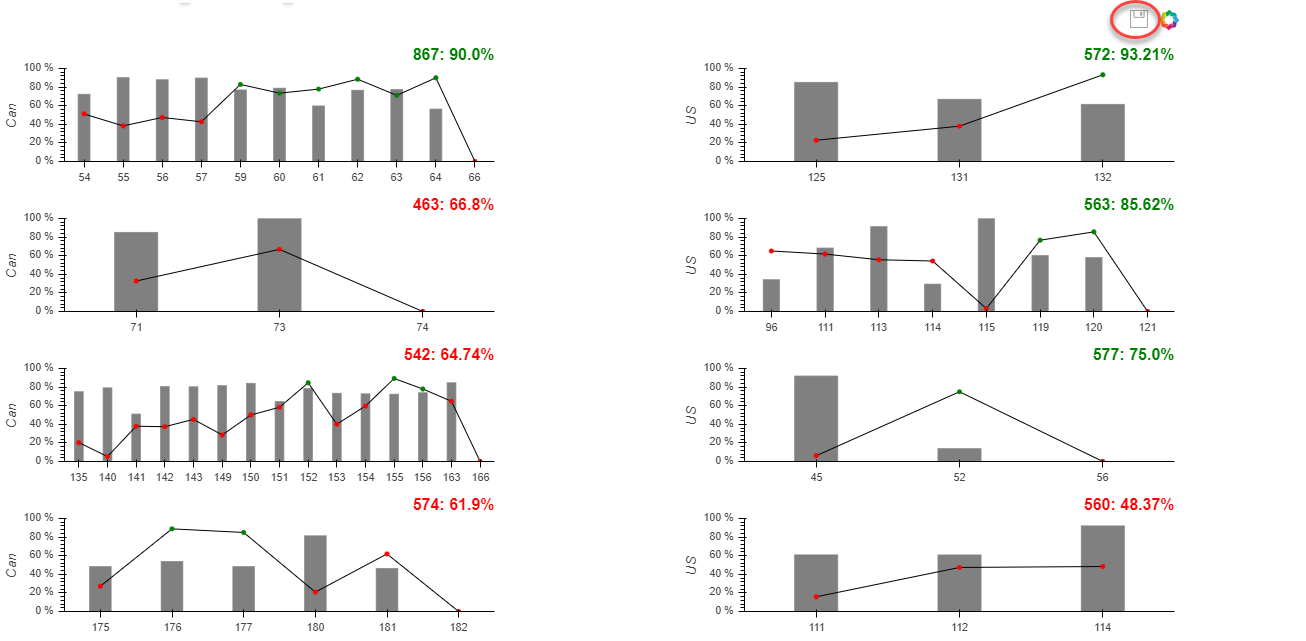
> if I try to share "save" tool across multiple plots, how could I could do? thanks
>
> <2019-02-11_10-54-41.png>
>
>
>
> my code like this:
>
>
> TOOLS = [SaveTool(), HoverTool()]
>
> rig_plot1 = figure(x_range = FactorRange(), \
> plot_width = 500, \
> plot_height = 150, \
> tools = TOOLS)
> rig_plot2 = figure(x_range = FactorRange(), \
> plot_width = 500, \
> plot_height = 150, \
> tools = TOOLS)
> rig_plot3 = figure(x_range = FactorRange(), \
> plot_width = 500, \
> plot_height = 150, \
> tools = TOOLS)
>
>
>
>
> It can not work as I expected. but, this solution can allow me to save plot one by one
>
>
>
> Welcome any clue, thank.
>
>
>
>
> --
> You received this message because you are subscribed to the Google Groups "Bokeh Discussion - Public" group.
> To unsubscribe from this group and stop receiving emails from it, send an email to bokeh+un...@continuum.io.
> To post to this group, send email to bo...@continuum.io.
> To view this discussion on the web visit https://groups.google.com/a/continuum.io/d/msgid/bokeh/ace79014-c5f3-4ec4-adf9-f2bbfd116666%40continuum.io\.
> For more options, visit https://groups.google.com/a/continuum.io/d/optout\.
> <2019-02-11_10-54-41.png>
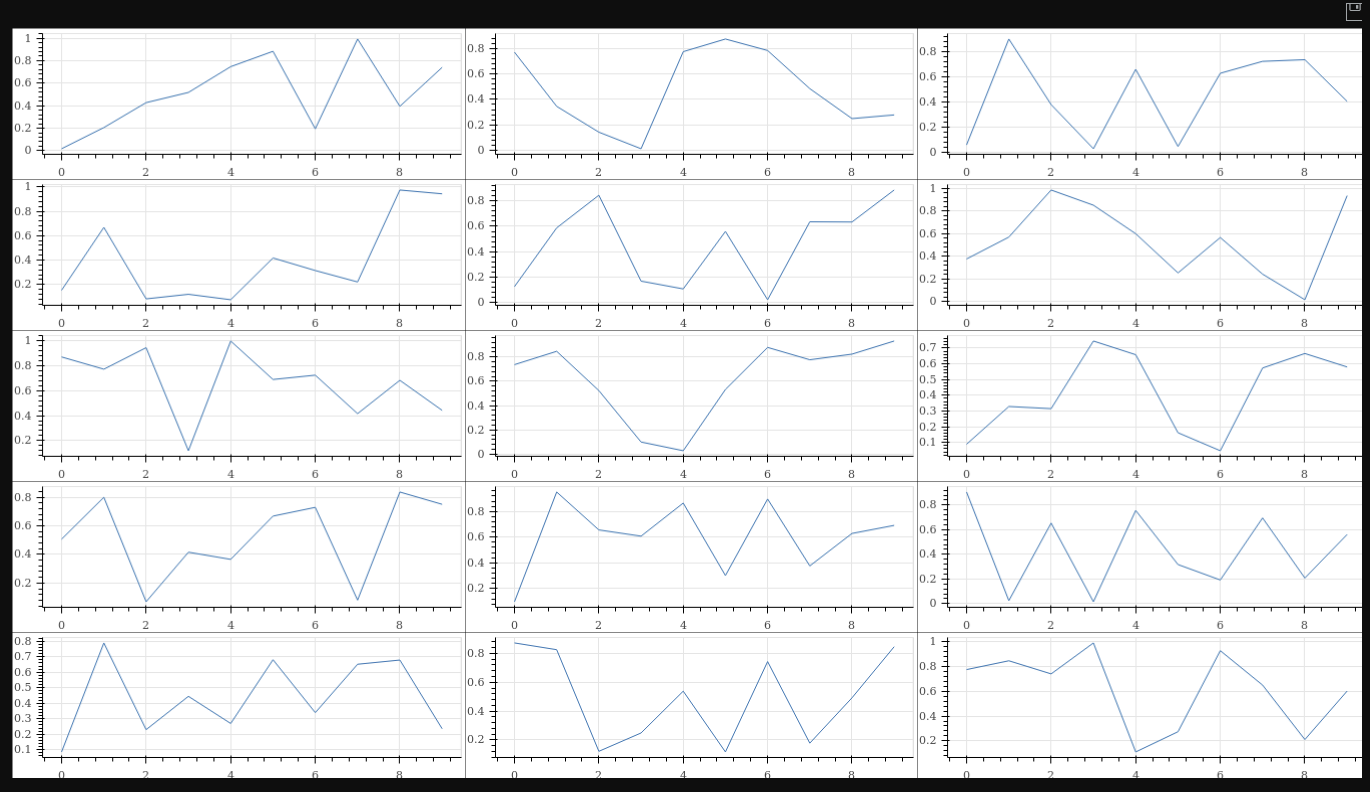
The following code works just fine using the export_png() method:
import numpy as np
from bokeh.layouts import gridplot
from bokeh.plotting import figure, show
from bokeh.io import export_png
plots = [figure(plot_height = 200, tools = ‘save’) for i in range(15)]
[plot.line(np.arange(10), np.random.random(10)) for plot in plots]
all = gridplot(plots, merge_tools = True, ncols = 3, sizing_mode = ‘scale_width’, toolbar_options = dict(logo = None))
export_png(all, filename = “gridplot_new.png”)
show(all)
``
Bokeh info:
Python version : 3.5.1 (default, Feb 1 2019, 21:29:47)
IPython version : (not installed)
Tornado version : 4.5.3
Bokeh version : 1.0.4
BokehJS static path : /usr/local/lib/python3.5/site-packages/bokeh/server/static
node.js version : v6.16.0
npm version : 3.10.10
On Monday, February 11, 2019 at 8:25:34 PM UTC+1, Bryan Van de ven wrote:
Hi,
Bokeh’s Python API function export_png can grab an entire document in one PNG, including grid plots. Otherwise I think you would have to look at coordinating Selenium and a headless browser to capture an image (which is all export_png does under the covers, anyway).
I can’t think of any current way to be able to do this from within the browser, i.e. with a plot tool.
On Tuesday, February 12, 2019 at 2:23:10 PM UTC+1, tony halik wrote:
The following code works just fine using the export_png() method:
import numpy as np
from bokeh.layouts import gridplot
from bokeh.plotting import figure, show
from bokeh.io import export_png
plots = [figure(plot_height = 200, tools = ‘save’) for i in range(15)]
[plot.line(np.arange(10), np.random.random(10)) for plot in plots]
all = gridplot(plots, merge_tools = True, ncols = 3, sizing_mode = ‘scale_width’, toolbar_options = dict(logo = None))
export_png(all, filename = “gridplot_new.png”)
show(all)
``
Bokeh info:
Python version : 3.5.1 (default, Feb 1 2019, 21:29:47)
IPython version : (not installed)
Tornado version : 4.5.3
Bokeh version : 1.0.4
BokehJS static path : /usr/local/lib/python3.5/site-packages/bokeh/server/static
node.js version : v6.16.0
npm version : 3.10.10
On Monday, February 11, 2019 at 8:25:34 PM UTC+1, Bryan Van de ven wrote:
Hi,
Bokeh’s Python API function export_png can grab an entire document in one PNG, including grid plots. Otherwise I think you would have to look at coordinating Selenium and a headless browser to capture an image (which is all export_png does under the covers, anyway).
I can’t think of any current way to be able to do this from within the browser, i.e. with a plot tool.