Hi, all, first time posting here so pls be gentle 
I am trying to plot an additional dataset over the existing (plotted) dataset.
- dataset1 is downloaded from GeoPandas and it is a map of the world.
- dataset2 is some other dataset for countries (not all countries) that I want to overplot over the existing map of the world.
The problem arises because those two datasets have different sources AND I need different tooltips for each. I cannot really merge the two datasets as they do not have the same dimensions.
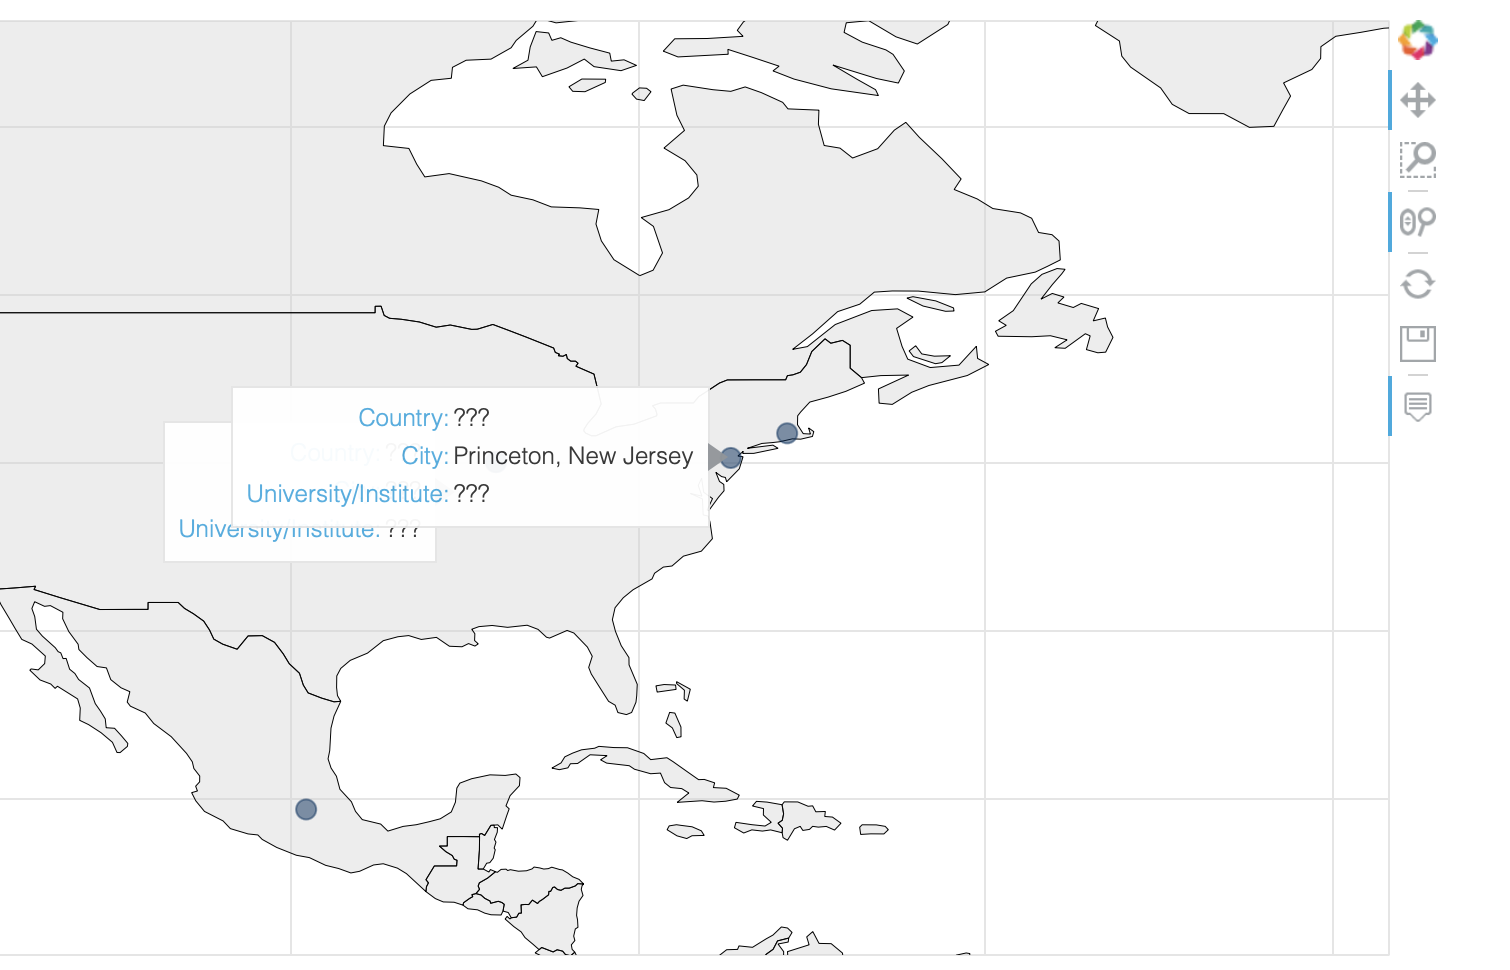
So, is there a way to solve this? I basically need something equivalent to two layers but both need to show in the interactive plot. For example, I want to preserve the hover over each country (even for the ones I do not have the dataset2 info on AND I want to have the detailed hover display for the dataset2.
Here is my code for the world map (but without the dataset2. let’s say it has a list of some cities, their lats and longs, and universities in it. I use p.circle to mark it down)
from bokeh.plotting import figure, show, output_notebook
import geopandas as gp

output_notebook()

world = gp.read_file(gp.datasets.get_path('naturalearth_lowres'))
geo_source = GeoJSONDataSource(geojson=world.to_json())

p = figure(title='World', tooltips=[('Country', '@name')],
           x_range=(-180, 180), y_range=(-90, 90),
           x_axis_location=None, y_axis_location=None,
           plot_width=1000, plot_height=500
          )
p.patches('xs', 'ys', fill_alpha=0.4, fill_color='grey',
          line_color='black', line_width=0.5, source=geo_source
         )
show(p)
If you can help me with this, I am giving away virtual chocolate and my eternal gratitude! Thanks in advance!