I’ve been having lots of success geoplotting points with Bokeh, but have now run into an issue trying to plot polygons and multi polygons where even the most basic plot times out (having left it for hours now). It’s my first time using GeoJSONDataSource and I think it’s time I asked for help. I carefully plotted a GeoPandas DataFrame of the below format. I’d upload the geojson because all the data was publicly available but it’s outputting a 162.8 MB file which I’m thinking might be the problem? Or do I have to treat the multi-polygons and polygons differently? The polygons are Canadian electoral districts.
Following a couple goodexamples online, I’m wondering why the code block hangs and won’t display in the notebook. I’m using Bokeh 2.0.2 with Python 3.8.2 in an VSCode workspace with an up to date Jupyter client and core installed.
This completes:
# Create Bokeh Data Structure
sourceG = GeoJSONDataSource(geojson = data_CAN.to_json())
Unfortunately even posting a couple geojson entires is over the character limit for the forums and I don’t have anywhere I can post and link a sample file.
However, I did learn something from the exercise.
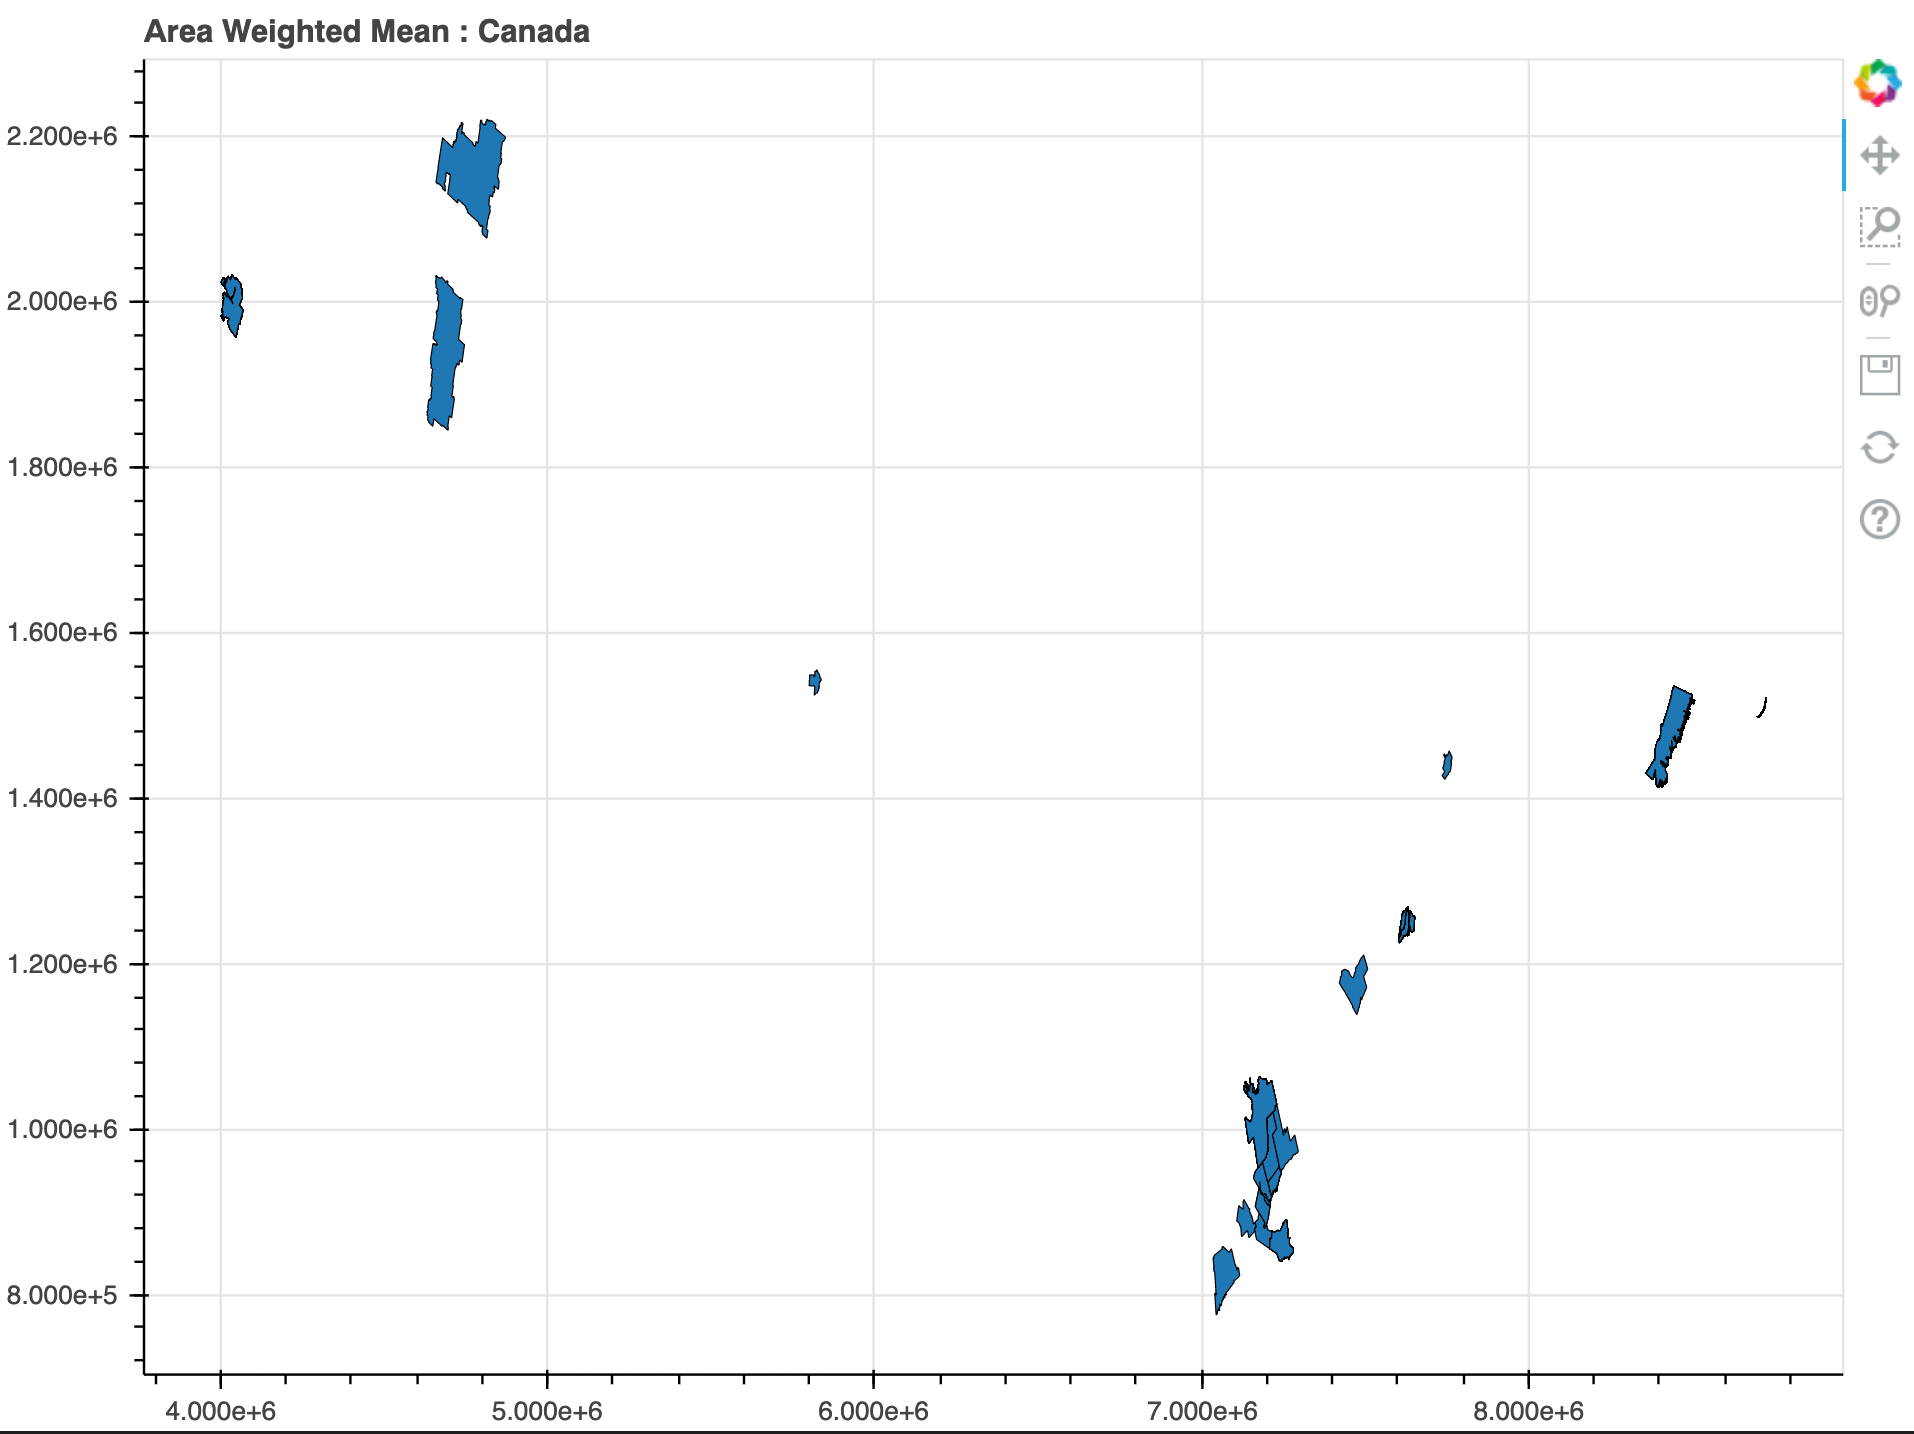
Taking the first 20 out of 293 does plot. However, it does really look like Canada.
Does that mean the problem is with the size of the GeoPandas Dataframe itself? I was under the impression bokeh was quite robust for large file sizes. But these are really complex polygons. Should I look at downsampling the polygons? I let it render in the cell for an hour and it never gave an error.
Or is it more likely I have invalid entries that are triggering it to time out?
I will say up front that this many polygons/points may simply be too taxing. Bokeh prioritizes interactivity and being able to drill down into data, but the tradeoff there is that all the data has to be sent to the browser. This is much m ore expensive (size wise) than say sending a rendered image. Tho it is possible there is some usage issue or other change that might improve things. But it’s hard to do more than speculate without a full code sample to run and experiment with, @p-himik has noted.
Note that Datashader now supports rendering polygons, and HoloViews or hvPlot can be used to construct Datashader-rendered polygon plots in Bokeh, allowing you to work with much larger polygonal datasets than would be practical in Bokeh itself. See e.g. Notebook :: Anaconda.org .
Hmmm… it even has dask integration… I think I’ll investigate this route because I have an even bigger viz of the US counties to try next. Thanks for the info.
Gist certainly seems like an interesting product. Finally had time to upload a sample dataset. I don’t dare do more than 50 entries of the over 200. But its there in the raw if thats helpful.
I assume that spatialpandas works similarly to geopandas? I wasn’t able to find a description of their differences but got errors when trying to install them in the same conda env.
What are those coordinates? They obviously aren’t lat/lon but I guess they don’t seem like the right order of magnitude for web-mercator either. Also, probably the most relevant question: what is the total number of points?
Other than that I agree with what has been said earlier. The level of detail in the data is massive overkill, it can never be shown on screen at once. Some options would be:
simplify
rasterize
load in chunks (based on extent/ zoom-level)
There are sections in the data which have a vertex every 20 to 30 meters or so, even (more or less) straight lines are sampled like that. Great as raw data, but that’s not something you want to visualize, regardless of the library you use. Due to all the straight administrative lines, you should be able to simplify it a lot without sacrificing much detail.
Oh good grief… I don’t think I realized the resolution was that small. I’ll go and try to simplify the paths a bit because I’m pretty comfortable with geopandas and don’t need to analyze the paths directly. Are there any good resources online you’d recommend to follow?