Nanoseconds on X axis

Hi everyone,

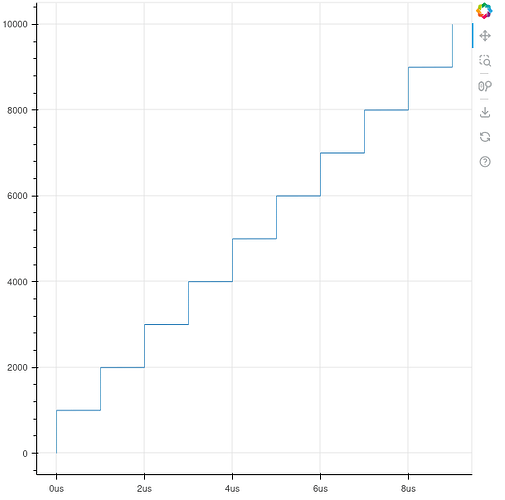
I’m trying to plot some curve with a nanosecond-precison X axis. Unfortunately that did not go well, as the X=Y plot ends up looking like a staircase: [BUG] Nanosecond-precision datetime is truncated to microsecond · Issue #13782 · bokeh/bokeh · GitHub

Is there any recommended workaround ? I am using bokeh via holoviews, but I’m interested in all pure-bokeh options as well (maybe I’ll end up implementing the workaround in holoviews bokeh backend).

Can you elaborate on things like:

  • where is the data coming from, i.e. are these actual datetimes [1] or are they really time deltas (measurement times off an instrument relative to a start, say)?
  • What range of values do you need to accommodate? i.e. are all the values a few orders of magnitude larger or smaller (in numbers of nanoseconds)?

If the answers is “yes these are really time deltas, and the values will only ever be between tens of picoseconds to hundreds of microseconds” (as an example) then the simplest thing to is not use datetime values at all. Pass Bokeh values that are floating point nanoseconds, or integer numbers of picoseconds, or whatever units makes sense for your situation [2], then use a standard numeric axis ticker, with a CustomJSTickFormatter to format the ticks however you need.

If not, you will need to go into more detail about your actual requirements.


  1. it seems unlikely anyone actually really only cares about the first nanoseconds after midnight January 1, 1970, but given what shown above, I have to ask to be certain… ↩︎

  2. Bokeh serializes datetime values as floating point millisecond-since-epoch, you will need to explicitly use something that provides more fidelity at the scale you are concerned with. ↩︎

Thanks for you answer. The data are time series coming from linux kernel’s ftrace traces. The range goes from minutes down to nanoseconds e.g. maybe you want to see the task scheduled in a very zoomed out way (e.g. heatmap) for some plots. Then you zoom/use another plot and investigate at the ms level. Then you want to time some operations that take less than 1us and see their relative ordering. This sort of stuff.

In absolute values, we typically end up with timestamps related to the system’s uptime (ftrace allows multiple clock sources so it depends on the trace), but we have a way to normalize the timestamps so that the trace starts at 0. It’s acceptable to ask people to use that option in case of loss of precision if necessary, and really most people will want it anyway. The only reason not to normalize is when crossing info between multiple tools that would not have that option.

So far we used pandas with a float32 number of seconds, but we are transitioning to polars. I want to take the occasion to transition to using the proper dtype, as float32 can easily mess computations. With polars.Duration dtype, we can preserve the real nanosecond integer timestamp, which has a number of benefits:

  • Faster computations on it
  • No fuzziness or loss of precision when increasing the magnitude
  • Timestamps more easily matched with other tools
  • Better display in plots (hopefully, so far it’s great when it works but this sort of issue is not isolated unfortunately)
  • Polars offers some rolling window computation and other time-related features if you use the appropriate Duration dtype.

If possible, I’d really like to have a ticker that displays the appropriate time unit based on the zoom level. Does x_axis_type=“datetime” provide anything else than that ?

Yes, handling different time scale is specifically the main purpose of the datetime axis configuration. Your largest scale is up to minutes? if it was only up to seconds, then I don’t think you’d need more than that the default “nice number” axis ticker, but once you get to minutes you’d want something that understands how to pick nice numbers on a minutes scale.

The datetime axis ticker is actually a CompositeTicker that specifies several different tickers that each operate at different scales e.g.

    tickers = Override(default=lambda: [
        AdaptiveTicker(
            mantissas=[1, 2, 5],
            base=10,
            min_interval=0,
            max_interval=500*ONE_MILLI,
            num_minor_ticks=0,
        ),
        AdaptiveTicker(
            mantissas=[1, 2, 5, 10, 15, 20, 30],
            base=60,
            min_interval=ONE_SECOND,
            max_interval=30*ONE_MINUTE,
            num_minor_ticks=0,
        ),
        AdaptiveTicker(
            mantissas=[1, 2, 4, 6, 8, 12],
            base=24,
            min_interval=ONE_HOUR,
            max_interval=12*ONE_HOUR,
            num_minor_ticks=0,
        ),
        DaysTicker(days=list(range(1, 32))),
        ...

In principle, you could define your own CompositeTicker subclass, that specifies custom tickers to use at different scales, that understand whatever datetime units your data is in. Unfortunately, at present there is not a super simple way for you to implement these new custom tickers. There is a CustomJSTickFormatter that enables users to define tick formatters by just providing a snippet of JavaScript implementation code. But a corresponding CustomJSTicker does not exist yet:

Add CustomJSTicker · Issue #13130 · bokeh/bokeh · GitHub

Until this is added, the only way to provide a custom ticker is to implement a complete custom extension, which is a fairly advanced and involved undertaking.

If you can forego “nice” minutes scale, then I think the standard BasicTickFormatter that chooses “nice” base-10 numbers for ticks (basically, multiples of 2, 5, and 10), along with a CustomJSTicker would suffice. Otherwise, I don’t have a super simple suggestion for you at the time being.
Ok I think in these conditions we will just cast back to a second-precision value as float as we used to when working with pandas (at least when doing plots). If we do that, scientific notation on the ticker is a good-enough replacement for the nice unit name so we are not actually loosing that much in the end. We also typically don’t suffer from loss of precision due large magnitude in numbers (as we can make plots start at X=0), so floats are not a deal breaker for that purpose. If the situation improves in the future, we should be able to take advantage of it as well.

Thanks for showing the options available

1 Like