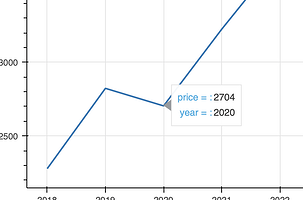
here is my revised code. Now I get 3 question marks for second tooltip
from bokeh.plotting import column, figure, show
from bokeh.models import ColumnDataSource, CustomJS, HoverTool, CustomJSHover
import json

x1 = [1, 2, 3, 4, 5, 6, 7, 8] # 8 time periods
y1 = [2278, 2823, 2704, 3225, 3714, 4515, 4076, 4890]

p = figure(width=650, height=600, title='Bokeh line graph with S&P data')
p.xaxis.axis_label = 'time by year'
p.yaxis.axis_label = 'S&P price over 7 years'
p.line(x1, y1, line_width=2)

    #add custom labels to ticks
p.xaxis.ticker = [1,2, 3, 4, 5, 6, 7, 8]
p.xaxis.major_label_overrides = {1:'2018', 2:'2019', 3:'2020', 4:'2021', 5:'2022',6:'2023',7:'2024',8:'2024.5'}
special = p.xaxis.major_label_overrides


x_custom = CustomJSHover(
    args=dict(special2=special), #passing my custom labels into customJS
    code="""
          return value +(Object.values(special2));
    """)

p.add_tools(HoverTool(
    tooltips=[
        ( 'price = ','@y{0.}' ),
        ( 'year = ','@special{custom}' )
    ],
    formatters={'@special': x_custom}
))
show(p)
