Hi,
I’m trying to format x-axis for duration/elapsed time. Depending on the data chosen by the user the data displayed can vary a lot with respect to duration so I need to be able to cover from less than a minute to days (measured in hours, hence if duration is 1 day and 7 hours, the axis should show in hh:mm).
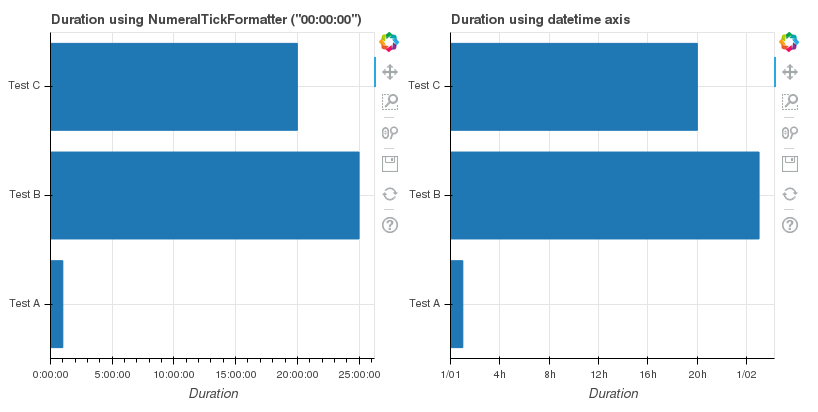
I have tried using NumeralTickFormatter with format="00:00:00". It works to some extent in the sence it show days in hours, but it is always on the format of hh:mm:ss. I had hoped it would automatically change between hh:mm or mm:ss depending on the data being displayed.
I have tried formatting the axis as datetime, but here the problem is that duration extending for more than a day, I’m not able to control have days in hours; when duration is 0 or 24 it is shown as a day/date.
Any help/hints with respect to formatting duration appreciated.
Cheers,
Jonas
from bokeh.io import output_file, save
from bokeh.plotting import figure
from bokeh.models import ColumnDataSource, NumeralTickFormatter, DatetimeTickFormatter
from bokeh.models import AdaptiveTicker
from bokeh.layouts import row

output_file('duration_axis.html')

data = {
    'test': ['Test A', 'Test B', 'Test C'],
    'duration_s': [3600, 90000, 72000],
}
data['duration_ms'] = [item*1000 for item in data['duration_s']]

src = ColumnDataSource(data = data)

plot1 = figure(
    plot_height = 400,
    plot_width = 400,
    y_range = data['test'],
)

plot1.hbar(
    right = 'duration_s',
    left = 0,
    y = 'test',
    height = 0.8,
    source = src
)

plot1.x_range.start = 0
axis_format = '00:00:00'
axis_mantissas = [3.6, 7.2, 18]
plot1.xaxis[0].formatter = NumeralTickFormatter(format = axis_format)
plot1.xaxis.ticker = AdaptiveTicker(base = 10, mantissas = axis_mantissas)
plot1.xgrid.ticker = AdaptiveTicker(base = 10, mantissas = axis_mantissas)

plot1.title.text = 'Duration using NumeralTickFormatter ("{}")'.format(axis_format)
plot1.xaxis[0].axis_label = 'Duration'

plot2 = figure(
    plot_height = 400,
    plot_width = 400,
    y_range = data['test'],
    x_axis_type = 'datetime'
)

plot2.hbar(
    right = 'duration_ms',
    left = 0,
    y = 'test',
    height = 0.8,
    source = src
)

plot2.x_range.start = 0

plot2.title.text = 'Duration using datetime axis'
plot2.xaxis[0].axis_label = 'Duration'

save(row(plot1, plot2))