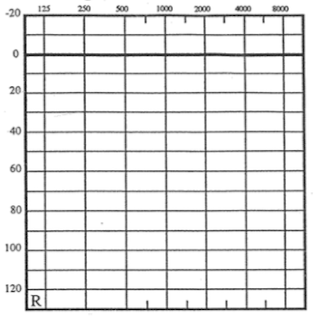
I’m trying to reproduce a graph known as a tone audiogram. It has some peculiar requirements:
- vertical (decibel) axis is inverted with specific major grid lines.
- horizontal (frequency) axis is in fact a log axis but its ticks are linear, and should only show the ticks/gridlines 125, 250, 500, 2000, 4000, 8000 (note the doubling of frequency values).
- the aspect ratio should be such that a the area bounded by 20 dB and a frequency doubling (say 250-500, or 4000-8000 Hz) is square.
1 is not a problem in Bokeh. 3 could be achieved (more or less) by fiddling with the plot size.
2 is the real challenge.
Any hints? TIA
