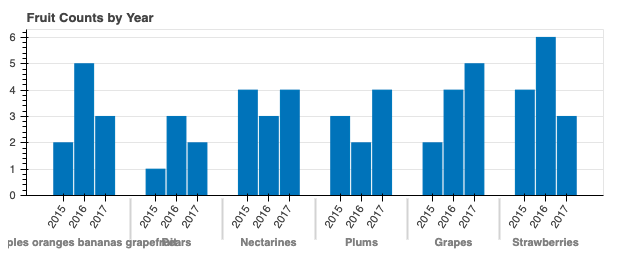
I want to make a nested bar chart that works for arbitrary data, and I want to truncate long labels. I don’t want to truncate the labels before creating the plot since this can introduce ambiguity and I want to show the full label in the tooltip. In this example:
from bokeh.io import show
from bokeh.models import ColumnDataSource, FactorRange
from bokeh.plotting import figure

fruits = ['Apples oranges bananas grapefruit', 'Pears', 'Nectarines', 'Plums', 'Grapes', 'Strawberries']
years = ['2015', '2016', '2017']

data = {'fruits' : fruits,
        '2015'   : [2, 1, 4, 3, 2, 4],
        '2016'   : [5, 3, 3, 2, 4, 6],
        '2017'   : [3, 2, 4, 4, 5, 3]}

# this creates [ ("Apples", "2015"), ("Apples", "2016"), ("Apples", "2017"), ("Pears", "2015), ... ]
x = [ (fruit, year) for fruit in fruits for year in years ]
counts = sum(zip(data['2015'], data['2016'], data['2017']), ()) # like an hstack

source = ColumnDataSource(data=dict(x=x, counts=counts))

p = figure(x_range=FactorRange(*x), plot_height=250, title="Fruit Counts by Year",
           toolbar_location=None, tools="")

p.vbar(x='x', top='counts', width=0.9, source=source)

p.y_range.start = 0
p.x_range.range_padding = 0.1
p.xaxis.major_label_orientation = 1
p.xgrid.grid_line_color = None

show(p)
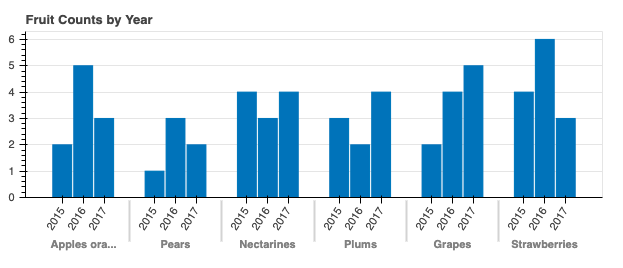
I want to truncate the “fruit” labels to show the first k characters of the label and then "...". E.g., for the label ’Apples oranges bananas grapefruit' with k=10, the new label will be Apples ora...:
I have tried using p.xaxis.major_label_overrides and
        p.xaxis.formatter = FuncTickFormatter(
            code="""
            if (tick.length > 10) return tick.substring(0, 10) + '...';
            else return tick;
        """
        )
but these apply to the “year” labels not to the “fruit” labels. Is there any way to get my desired result?
Thanks