Hi, I’m new to Bokeh and the forum.
I am trying to build SPC charts in Bokeh. (I saw a good example in the gallery, but no code available?) My actually use case is (obv) more complicated than this, with typical dataframes have 10k+ obs (rows) and ~70 tracked variables (cols).
Want to have:
Nested x-axis categoricals: does this require a ColumnDataSource? Does it require aggregation? Can I plot these directly from a pandas df? Is there a limit to how many? The error messages appear to inidicate a limit of three; why? Tableau, AFAICT, has no limit. Is there a speed hit? Plotting ~8 datapoints takes 1 full second on a brand-new laptop.
Tooltips: does this require a ColumnDataSource? Whem plotting from a dataframe, I can get tooltips, but the values are “???”, and each data point has ~6 associated “???”'s with it.
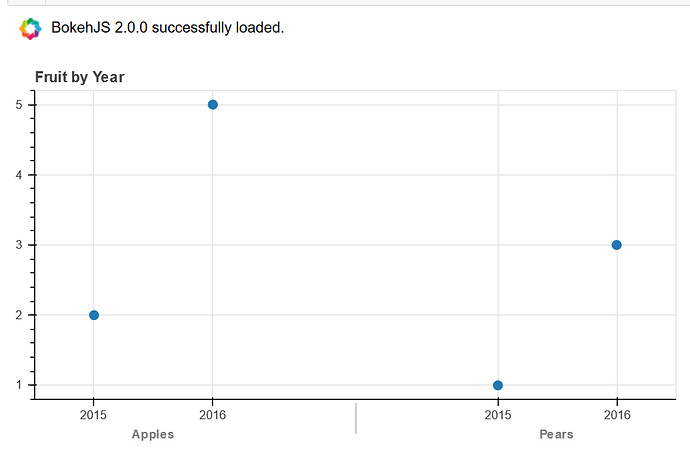
Here’s a toy problem based on the docs. Is this the canonical way to do this? Can I declare a CDS without a df.groupby(), and then nest the x-axis categoricals? (Most categorical plots I try end up empty, which is and will be a separate question.)
from bokeh.io import output_file, show
from bokeh.models import ColumnDataSource, FactorRange
from bokeh.plotting import figure

reset_output()
output_notebook()
fruits = ['Apples', 'Pears']
years = ['2015', '2016']

data = {'fruits' : fruits,
        '2015'   : [2, 1],
        '2016'   : [5, 3]}

fruit_df = pd.DataFrame(data).set_index("fruits")
display(fruit_df) # not tidy

tidy_df = fruit_df.reset_index().melt(id_vars=["fruits"], var_name="year")
tidy_df = tidy_df.rename(columns={"fruits":"fruit"})
display(tidy_df) # tidy

# make pandas group
group_cols = ["fruit", "year"]
group = tidy_df.groupby(group_cols)

# declare these variables because later Bokeh arguments are string-based
x_string = "_".join(group_cols)
y_col = "value"

# make CDS of group
source = ColumnDataSource(group)

# make figure
p = figure(plot_height=350,
           x_range=group,
           title="Fruit by Year",
           toolbar_location=None,
           tools="")

# add glyphs? renderers? dunno?
p.circle(x=x_string,
         y=y_col + "_mean", # why do we need to calculate the mean?
         width=5,
         source=source,
        )

# show figure
show(p)
Output:
TIA, have spent a couple days on this so would really appreciate getting unstuck.

