Hi,
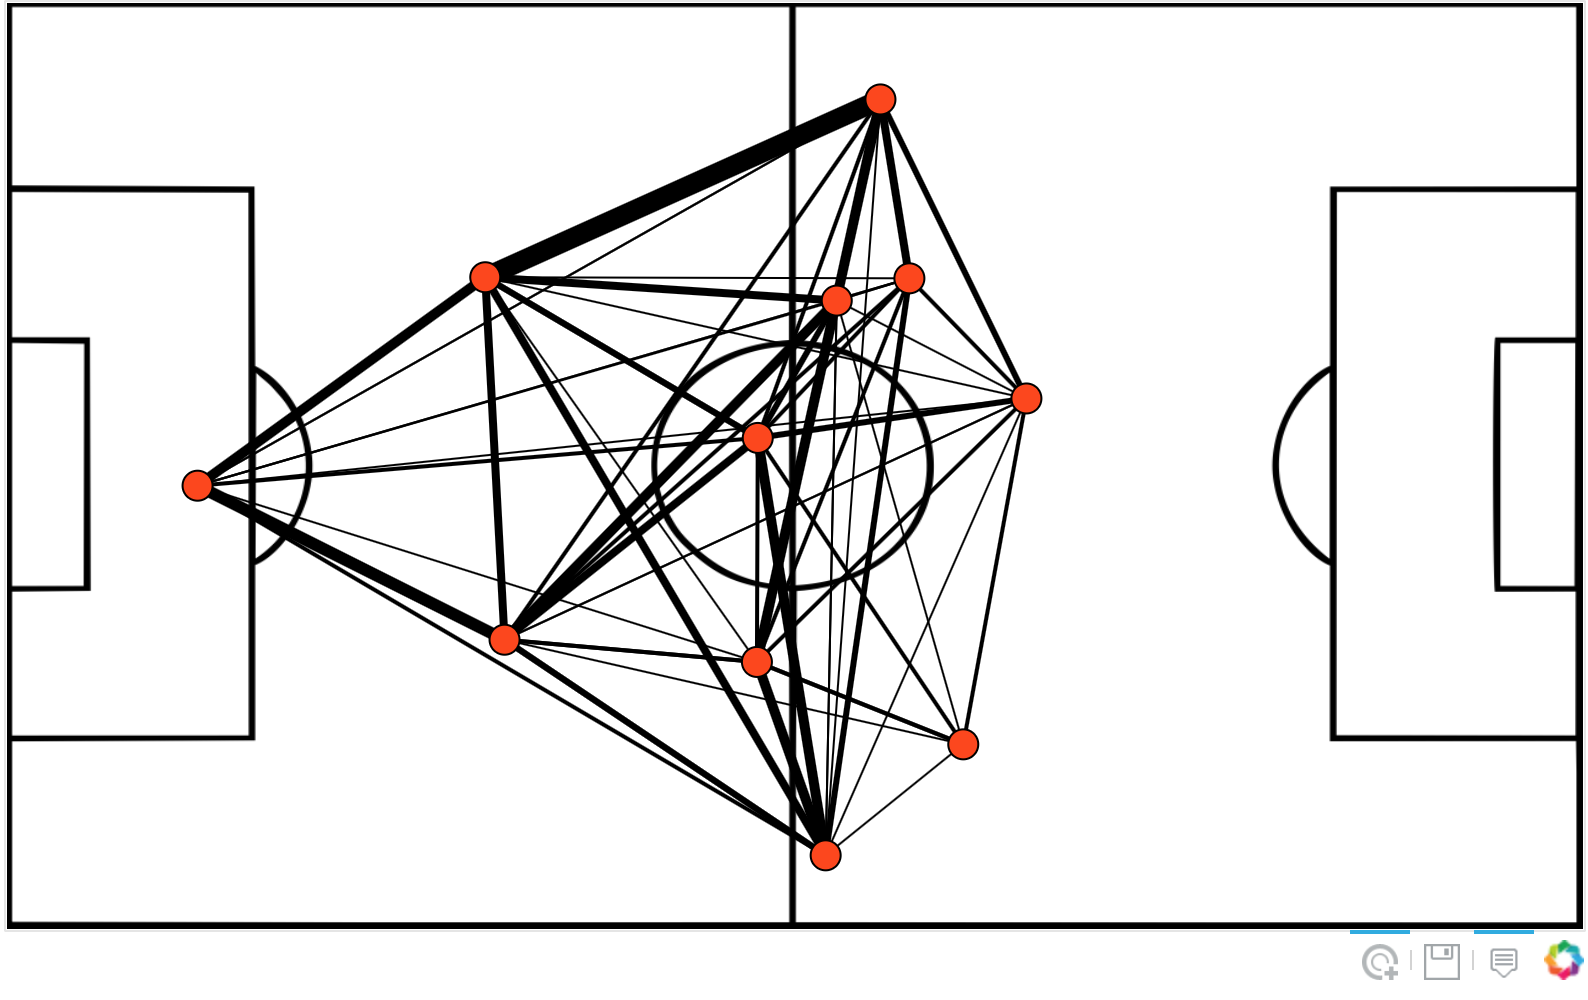
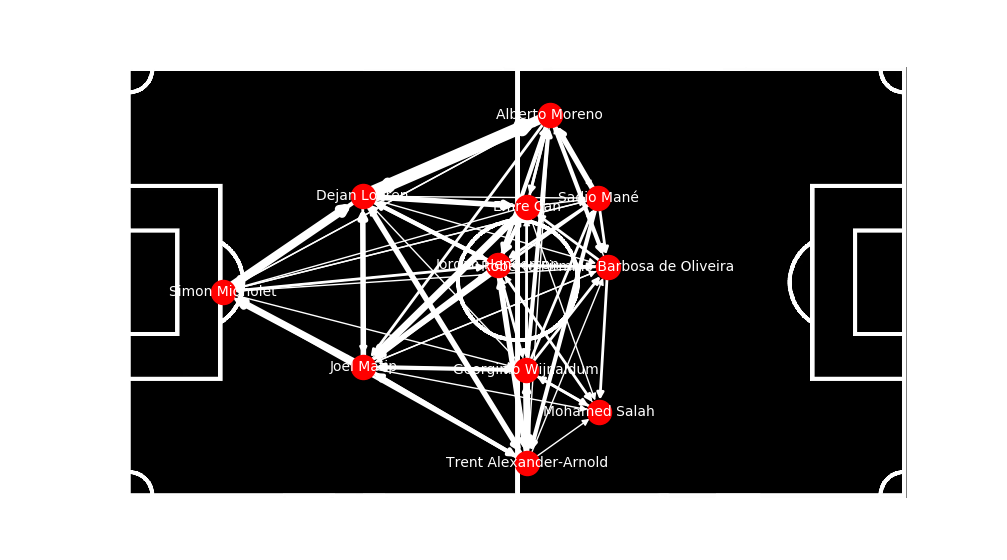
I’m trying to display a networkx graph on bokeh. I’ve used nx.get_node_attributes(G,‘pos’), to plot the networkx graph. The position of each node is fixed based on input.
Is there a way to display it on Bokeh, using the from_networkx function? I can only use forced layout like spring/circular in the from_networkx function and not the nx.get_node_attributes.
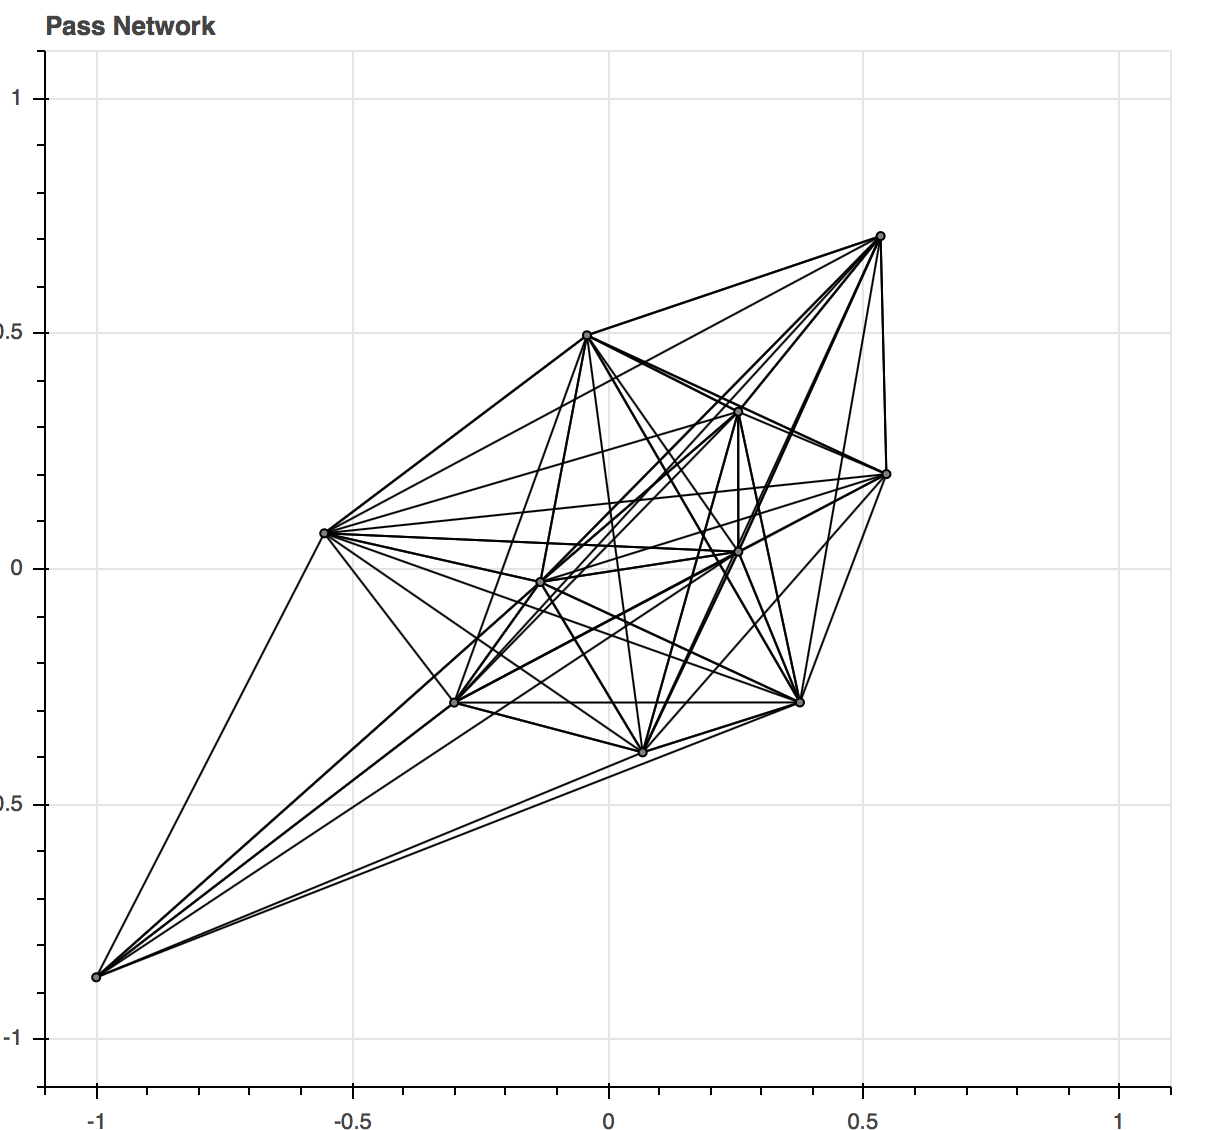
The expected output on Matplotlib and the output, with spring layout on Bokeh.
Any help would be appreciated.
Thanks.
···
Hi.
Currently (ver 0.13.0) Bokeh, from_networkx function requests a layout function. Therefore, I specify a layout function (eg nx.spring_layout function, etc.) as a dummy and then update the layout_provider attribute with a fixed layout.
layout_provider | GraphRenderer
I uploaded the code below. I hope this will help
http://nbviewer.jupyter.org/github/komo-fr/networkx2bokeh_note/blob/master/notebooks/networkx2bokeh_layout_for_custom_position.ipynb
The following pages are helpful too.
https://bokeh.pydata.org/en/latest/docs/user_guide/examples/graph_customize.html
···
graph_layout = dict(zip(node_indices, zip(x, y)))
graph.layout_provider = StaticLayoutProvider(graph_layout=graph_layout)
Hi,
This worked perfectly. Thanks for the help.
···
On Saturday, 22 September 2018 21:51:15 UTC-7, komo-fr (Tomoko Furuki) wrote:
Hi.
Currently (ver 0.13.0) Bokeh, from_networkx function requests a layout function. Therefore, I specify a layout function (eg nx.spring_layout function, etc.) as a dummy and then update the layout_provider attribute with a fixed layout.
layout_provider | GraphRenderer
I uploaded the code below. I hope this will help
http://nbviewer.jupyter.org/github/komo-fr/networkx2bokeh_note/blob/master/notebooks/networkx2bokeh_layout_for_custom_position.ipynb
The following pages are helpful too.
https://bokeh.pydata.org/en/latest/docs/user_guide/examples/graph_customize.html
graph_layout = dict(zip(node_indices, zip(x, y)))
graph.layout_provider = StaticLayoutProvider(graph_layout=graph_layout)