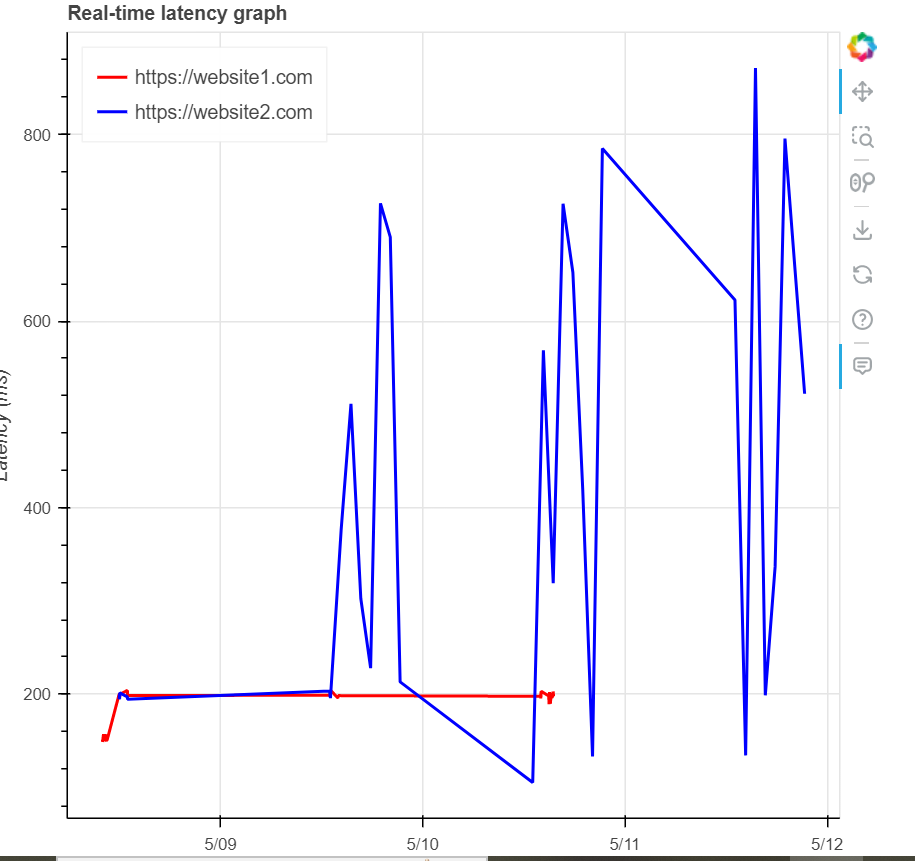
I have been checking my code through and through. Even using chatgpt to find the errors. But I really don’t know what’s the problem, I cannot see my graph. I can only see the axes. Here is the output in image:

It is empty, my code is reading the data from a file. This is my first time using Bokeh, please help me to rectify the issue, I have been stuck here for so long. About a week.
Really appreciate your help to look at the code provided below. I did not get any error messages too, which is why it is hard for me to pinpoint where is the error specifically.
from datetime import datetime
from bokeh.plotting import figure, curdoc
from bokeh.models import ColumnDataSource, HoverTool
import traceback
try:
    # Create a ColumnDataSource object to store the data
    source = ColumnDataSource(data=dict(x=[], y=[], url=[], color=[]))

    # Create a figure object
    p = figure(title="Real-time latency graph", x_axis_type='datetime', x_axis_label='Date & Time',
               y_axis_label='Latency (ms)')

    # Adjust the padding as needed
    p.x_range.range_padding = 0.1

    # Add a multi_line glyph to the figure
    p.multi_line(xs='x', ys='y', source=source, line_width=2, line_color='color', legend_field='url')

    # Add a hover tool to the figure
    hover = HoverTool(tooltips=[('Date & Time', '@x{%F %T}'), ('Latency (ms)', '@y{0.00}'), ('URL', '@url')])
    hover.formatters = {'@x': 'datetime'}
    p.add_tools(hover)

    # Set up the legend
    p.legend.location = 'top_left'
    p.legend.click_policy = 'hide'

    # Define a list of colors for the URLs
    url_colors = ['red', 'green', 'blue', 'orange', 'purple', 'yellow']

    def update_graph():
        xs, ys, urls, colors = [], [], [], []
        data = []
        try:
            with open(r"C:\Users\Anne\OneDrive - RIS Group\Desktop\TestLaData.txt", 'r') as f:
                for line in f:
                    parts = line.strip().split()
                    if len(parts) >= 4:
                        date_time = datetime.strptime(parts[0] + ' ' + parts[1], '%Y-%m-%d %H:%M:%S')
                        url = parts[2]
                        latency = float(parts[3])
                        # Assign a color to the URL based on its position in the list
                        color = url_colors[len(urls) % len(url_colors)]
                        xs.append(date_time)
                        ys.append(latency)
                        urls.append(url)
                        colors.append(color)
                        data.append((date_time, latency, url, color))

            if not data:
                # Handle empty data
                p.y_range.start = 0
                p.y_range.end = 1
                p.x_range.start = datetime.now()
                p.x_range.end = datetime.now()
            else:
                # Set the y-axis range based on the data
                p.y_range.start = min(ys) - 10  # Adjust the range by a small margin
                p.y_range.end = max(ys) + 10
                # Set the x-axis range based on the data
                p.x_range.start = min(xs)
                p.x_range.end = max(xs)

            # Update the data in the ColumnDataSource object
            source.data = dict(x=xs, y=ys, url=urls, color=colors)

        except Exception as e:
            print("Error occurred while updating the graph:")
            print(e)
            traceback.print_exc()  # Print the error traceback

    def update():
        try:
            update_graph()
            curdoc().add_next_tick_callback(update)
        except Exception as e:
            traceback.print_exc()  # Print the error traceback

    # Set up timer to redraw graph every 5 seconds
    curdoc().add_next_tick_callback(update)

    # Display the figure using Bokeh server
    curdoc().title = "Canary Monitoring Websites"
    curdoc().add_root(p)

except Exception as e:
    traceback.print_exc()  # Print the error traceback
This is the sample data stored in the file.
2023-05-10 15:28:00 https://website1.com 201.19
2023-05-10 15:29:00 https://website1.com 202.53
2023-05-10 15:30:00 https://website1.com 202.13
2023-05-10 15:31:00 https://website1.com 200.71
2023-05-10 15:32:00 https://website1.com 197.95
2023-05-08 12:00:00 https://website2.com 194.38
2023-05-08 12:01:00 https://website2.com 198.71
2023-05-08 12:02:00 https://website2.com 199.84