Hello,
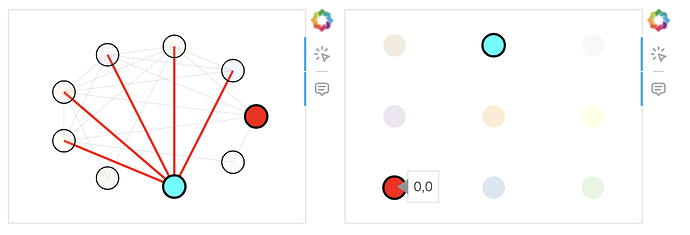
I have two linked plots, one is a basic scatter plot, the other a network graph.
On the network graph, I have the selection_policy and inspection_policy set to NodesAndLinkedEdges, and this works well when interacting with the network graph. However the linked edges do not get triggered when interacting with it from the scatter (only the corresponding node does).
I can get around it by using a CustomJS callback, so that when I select a glyph on the scatter the corresponding glyph on the network graph (and its linked edges) also get selected, however I am currently stumped as to how to also accomplish this when hovering over the scatter.
On the screenshot, the mouse is hovering on (0,0) on the scatter, which corresponds to the red dot on the network. The cyan dot is the current selection.
I have not posted this question elsewhere, and have not been able to find similar questions. Code for MRE is below.
My two questions:
- Is this expected behaviour?
- Ideas for how to also trigger the linked edges when hovering from the scatter?
Thank you!
Bokeh version : 3.0.3
import numpy as np
import networkx as nx

from bokeh.models import ColumnDataSource, CustomJS
from bokeh.models import Range1d, Circle, ColumnDataSource, MultiLine, EdgesAndLinkedNodes, NodesAndLinkedEdges

from bokeh.palettes import Pastel1
from bokeh.plotting import figure, from_networkx
from bokeh.layouts import column, row, gridplot, layout
from bokeh.io import show, output_notebook


G = nx.random_geometric_graph(9, .5, seed=0)

p1 = figure(width=300,height=200,
            x_range=[-1.5,1.5],
            y_range=[-1.5,1.5],
            x_axis_location=None, y_axis_location=None,
            tools="hover,tap",
            tooltips="@coords")
p1.grid.grid_line_color = None

graph = from_networkx(G, nx.circular_layout)
p1.renderers.append(graph)


mx, my = np.meshgrid(np.arange(3),np.arange(3))
mx = mx.reshape((9))
my = my.reshape((9))

node_cds = ColumnDataSource(dict(
            index = list(range(len(G))),
            coords= [i for i in zip(mx,my)],
            colors = Pastel1[9],
            x=mx,
            y=my
            ))

graph.selection_policy = NodesAndLinkedEdges()
graph.inspection_policy = NodesAndLinkedEdges()

graph.node_renderer.data_source = node_cds

graph.node_renderer.glyph = Circle(size=20, fill_color="colors", line_width=1)

graph.node_renderer.selection_glyph = Circle(fill_color="cyan",
                                             size=30,
                                             line_width=2,
                                             line_color="black")

graph.node_renderer.hover_glyph = Circle(fill_color="red",
                                         line_width=2,
                                         size=30,
                                         line_color="black")

edge_cds = ColumnDataSource(data = dict(
    start   = [ i[0] for i in G.edges ],
    end     = [ i[1] for i in G.edges ],
))

graph.edge_renderer.glyph = MultiLine(
                    line_color="black",
                    line_width=1, line_alpha=1)

graph.edge_renderer.selection_glyph = MultiLine(
                    line_color="red",
                    line_width=2, line_alpha=1)

graph.edge_renderer.hover_glyph = MultiLine(
                    line_color="yellow",
                    line_width=2, line_alpha=1)

graph.edge_renderer.nonselection_glyph = MultiLine(
                    line_color="gray",
                    line_width=.25, line_alpha=.5)

graph.edge_renderer.data_source = edge_cds

p2 = figure(
            match_aspect=True,
            width=300,height=200,
            x_axis_location=None, y_axis_location=None,
            x_range=[-.5,2.5],
            y_range=[-.5,2.5],

            aspect_scale=1,
            tools="hover,tap",
            tooltips="@coords")

p2.grid.grid_line_color = None

p2.scatter(source=node_cds,
                size=20,
                marker="circle",
                fill_color="colors",
                line_color="black",
                line_width=0,
                hover_line_width=2,
                hover_fill_color="red",
                hover_line_color="black",
                selection_fill_color="cyan",
                selection_line_width=2,
           nonselection_alpha=.5

    )


select_cb = """

var inds = cb_obj.indices

/***
 * Trigger Edges selection on linked graph
 */

var edge_idx_list = []

for(var i = 0; i < edge_cds.get_length(); i++){
    if(inds.includes(edge_cds.data['start'][i]) || inds.includes(edge_cds.data['end'][i])){
        edge_idx_list.push(i)
    }
}

edge_cds.selected.indices = edge_idx_list
edge_cds.change.emit()
"""
node_cds.selected.js_on_change('indices', CustomJS(args=dict(edge_cds=edge_cds),code=select_cb))

prow = row(p1,p2)

output_notebook()
show(prow)
