Dear Bryan and Community:
Now I am at least able to get through these notebooks and ask more targeted questions. Currently, as you can tell from the title of this topic, I am on Axis Styling, specifically, this part:
# change just some things about the y-axes
p.yaxis.axis_label = "Pressure"
p.yaxis.major_label_text_color = "orange"
p.yaxis.major_label_orientation = "vertical"
It turns out that “major_label” refers to the integers, which I was not expecting at all. I suppose it is academic at this point, but why aren’t those called ‘tick_label’, instead? Can I infer that if it is possible to label the intervening ticks, that they would be called ‘minor_label’?
The other thing that confused me on this section was this code:
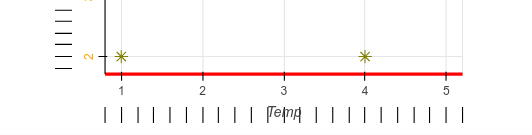
# change things on all axes
p.axis.minor_tick_in = -3
p.axis.minor_tick_out = 6
I don’t understand what these values, -3 and 6, are doing at all. I don’t see how they relate to the ticks this code, as a whole, produces. For the exercise, I reduced both values by 1/10, and got this error:
ValueError: failed to validate LinearAxis(id='11252', ...).minor_tick_in:
expected a value of type Integral, got -0.3 of type float
What the heck is an Integral? Is that the same as an integer?
When I took the exercise the other way, *10, I got this:
Which I still can’t make heads or tails of. It occurred to me that maybe tick in is above the axis and tick out is below, but if so, why are there no such ‘in’ ticks in the original plot? Can you help me understand what this is supposed to be doing, and what the value of it is? Thanks.