Hi,
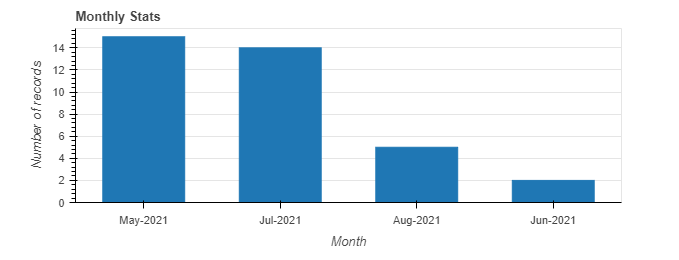
I am new to Bokeh and I was trying the following plot with my pandas df. The df is sorted as per my needs( by chronological order of month) and I want the bars to appear in the same way(May,June,July etc…,) while the bars shown are in the descending order of value for each month. Is there a way to sort the bars according to the df ?
This is my sample code snippet.
data=mdf
p = figure(x_range=mdf[‘month’], plot_height=250, title=“Monthly Stats”,
toolbar_location=None, tools="")
p.vbar(x=mdf[‘month’], top=mdf[‘count’], width=0.6)
p.add_tools(HoverTool(tooltips=[(“Records”, “@top”)]))
p.xgrid.grid_line_color = None
p.xaxis.axis_label = “Month”
p.yaxis.axis_label = “Number of records”
p.y_range.start = 0
show(p)
Thanks,
Ananya