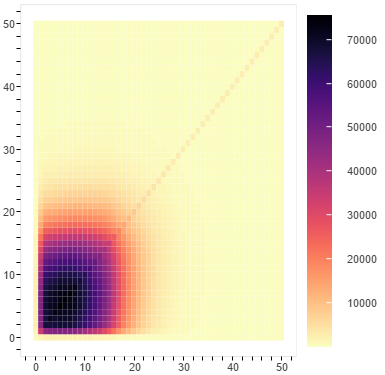
I started to use rect() to make matrix plots, however I have a padding between the axes and the glyph (the white spaces in the atatched picture) and I failed to find if a parameters exists to remove it. Anyone knows how to do it?
Thanks,
Seb
I started to use rect() to make matrix plots, however I have a padding between the axes and the glyph (the white spaces in the atatched picture) and I failed to find if a parameters exists to remove it. Anyone knows how to do it?
Thanks,
Seb
You can set range_padding to zero:
bokeh.models.ranges — Bokeh 0.12.5 documentation
on the plot's x_range and y_range. Alternatively, you can set the range values explicitly when you call "figure", to prevent "auto" ranging.
Bryan
On Apr 10, 2017, at 09:15, [email protected] wrote:
I started to use rect() to make matrix plots, however I have a padding between the axes and the glyph (the white spaces in the atatched picture) and I failed to find if a parameters exists to remove it. Anyone knows how to do it?
Thanks,
Seb--
You received this message because you are subscribed to the Google Groups "Bokeh Discussion - Public" group.
To unsubscribe from this group and stop receiving emails from it, send an email to [email protected].
To post to this group, send email to [email protected].
To view this discussion on the web visit https://groups.google.com/a/continuum.io/d/msgid/bokeh/560ce22f-4f21-4e0d-9737-cde4dc5751c5%40continuum.io\.
For more options, visit https://groups.google.com/a/continuum.io/d/optout\.
<heatmap_padding.png>