Pandas dataframe to Tooltip

(Bokeh3.2.2) Passing a pandas dataframe to ColumnDataSource( so that the df_data can be seen as a Tooltip),results in an RuntimeError(source = ColumnDataSource(data=dict(x=a_list, y=an_array)when the source is passed to a figure.circle object.How to show df_data as a tooltip?

from bokeh.plotting import figure, show
from bokeh.models import ColumnDataSource

# Create a ColumnDataSource from your DataFrame
source = ColumnDataSource(df)

TOOLTIPS = """
    <div>
        <div>
            <span style="font-size: 17px; font-weight: bold;">@Time:@Spot</span>
            <span style="font-size: 15px; color: #966;">@Strike:(@cLtp, @pLtp)[@cSellOi{(0.00 a)}, @pSellOi]{(0.00 a)}</span>
        </div>
    </div>
"""

# Create the figure
plot = figure(
    title=f'{indexCode}({spotPrice})',
    x_axis_label="Time",
    x_axis_type="datetime",
    y_axis_label="cSellOi",
    background_fill_color="black",
    sizing_mode="stretch_both",
    tooltips=TOOLTIPS
)

# Use the ColumnDataSource as the data source for glyphs
plot.circle(x='Time', y='cSellOi', source=source, size=10, color="white")

# Show the plot
show(plot)
df = 
      Time   Spot  Strike  cLtp  pLtp  cSellOi  pSellOi   OiSell     OiSB
5    12:13  19653   19600    99    49   851500  2530350  1678850  1917400
3    12:13  19653   19500   174    24   267500  1615600  1348100   390850
13   12:10  19645   19500   167    24   379050  1656000  1276950   301150
23   12:07  19640   19500   167    25   382350  1606500  1224150   257200
35   12:05  19629   19600    91    51  1324350  2542100  1217750  1525100
33   12:05  19629   19500   165    24   389700  1598450  1208750   278600
43   12:01  19625   19500   161    26   438850  1646950  1208100   183500
15   12:10  19645   19600    93    50  1318250  2519050  1200800  1249550
25   12:07  19640   19600    93    51  1365900  2544450  1178550  1307150
53   10:28  19614   19500   160    29   449000  1488200  1039200   141750
73   10:21  19616   19500   162    29   433200  1460400  1027200   229400
83   10:21  19616   19500   162    29   433200  1460400  1027200   229400
45   12:01  19625   19600    89    53  1594200  2599650  1005450   995200
4    12:13  19653   19550   135    34   268600  1263450   994850   777050
63   10:25  19615   19500   159    29   451850  1421650   969800    32650
103  10:18  19622   19500   159    29   454600  1413850   959250    94150

ERROR:

RuntimeError: 

Expected x and y to reference fields in the supplied data source.

When a 'source' argument is passed to a glyph method, values that are sequences
(like lists or arrays) must come from references to data columns in the source.

For instance, as an example:

    source = ColumnDataSource(data=dict(x=a_list, y=an_array))

    p.circle(x='x', y='y', source=source, ...) # pass column names and a source

Alternatively, *all* data sequences may be provided as literals as long as a
source is *not* provided:

    p.circle(x=a_list, y=an_array, ...)  # pass actual sequences and no source
@srt111 I don’t see anything obviously wrong. I’d love to run your code directly but you’d first need to update it to be entirely self-contained and complete, i.e. something I can can copy and paste and run with no modifications whatsoever. So, either generate a synthetic dataframe in the code or add the exact pandas code to load a file the expected way, and give link to a file. [1]


  1. It may seem like a small thing but there’s still room for wasting time on back and forth due to misunderstandings or bad assumptions. I have answered many thousands of questions at this point… I need users to help me help them, as much as possible. ↩︎

@Bryan Thanks for looking into the issue .I managed to get the ‘NESTED’ dataframe to show in the tooltip , but while trying to iterate over the dataframe for data unique to a timestamp,Bokeh doesn’t recognise the SOURCE data in javascript .How to iterate over a nested dataframe to display all values at the applicable timestamp and display it in the tooltip ?

import pandas as pd
from bokeh.models import HoverTool, ColumnDataSource, DatetimeTickFormatter, CustomJS
from bokeh.plotting import figure, show

data = {
    "Time": ["12:03", "12:03", "12:03", "12:03", "12:12", "12:12", "12:12", "12:12", "12:17", "12:17", "12:17", "12:17"],
    "Spot": [19653, 19653, 19653, 19653, 19629, 19629, 19629, 19629, 19640, 19640, 19640, 19640],
    "Strike": [19500, 19600, 19700, 19800, 19500, 19600, 19700, 19800, 19500, 19600, 19700, 19800],
    "cLtp": [99, 174, 167, 167, 91, 165, 161, 93, 95, 16, 12, 31],
    "pLtp": [49, 24, 42, 25, 51, 74, 36, 53, 21, 29, 75, 32],
    "cSellOi": [851500, 267500, 379050, 382350, 1324350, 389700, 438850, 1318250, 1365900, 449000, 433200, 433200],
    "pSellOi": [2530350, 1615600, 1656000, 1606500, 2542100, 1598450, 1646950, 2519050, 2544450, 1488200, 1460400, 1460400],
    
}

df = pd.DataFrame(data)

# Convert the 'Time' column to datetime
df['Time'] = pd.to_datetime(df['Time'], format='%H:%M')
df.sort_values(by='Time', inplace=True)

source = ColumnDataSource(df)

plot = figure(
    x_axis_label="Time",
    y_axis_label="Spot",
    x_axis_type="datetime",
    title="Dataframe in Tooltip",
)

plot.line(x='Time', y='Spot', source=source, line_width=3, line_color="blue")

plot.xaxis.formatter = DatetimeTickFormatter(
    days="%Y-%m-%d",
    hours="%H:%M:%S",
    minutes="%H:%M"
)

# Create a custom JavaScript callback for the hover tool
custom_hover = HoverTool(
    tooltips=  """
     args={'source': source, 'hover': custom_hover},
        var data = source.data;
        var time = data.index['1d'].indices[0];

    function generateTooltip(data) {
            var tooltipString = "";
            tooltipString = data['Time'][time] : data['Spot'][time];
            for (var i = 0; i < data['Strike'][time].length; i++) {
                tooltipString += data['Strike'][time][i] + ": (" + data['cLtp'][time][i] + ", " + data['pLtp'][time][i] + ")[";
                tooltipString +=  data['cSellOi'][time][i] + ", " + data['pSellOi'][time][i] + ")\n";
            }


        hover.tooltips = generateTooltip;
        hover.change.emit();
    """
)

plot.add_tools(custom_hover)

show(plot)

Hi @srt111 this new code is not like the old code at all really. I am honestly not sure what you are trying to do. The value of tooltips is either:

  • a list of (label, field) tuples, that will result in a basic table for the tooltip, or
  • a string template with fields embedded that will be rendered for the tooltip

There is no usage scenario where it makes sense to assign code as the value of tooltips (and the hovertool will not ever execute such code). In that sense the script above is behaving exactly as I would expect (it’s displaying the code as literal text of the tooltip). [1]

To be honest this situation seems like a case of XY Problem and it might be more productive for you to describe what exactly you are trying to accomplish at a high level, without assuming the form of any particular solution.


  1. The closest thing to that would be CustomJSHover that can compute the value for a single hover field. ↩︎

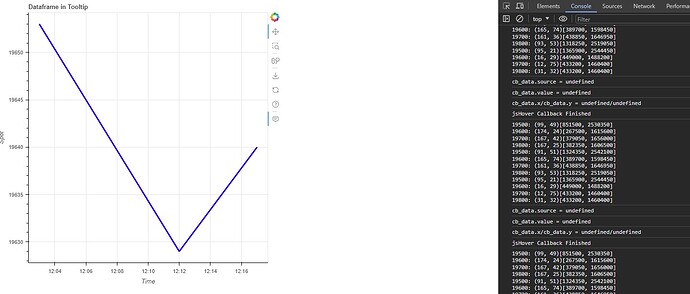
Its now possible to access pandas dataframe in javascript via callback , but

cb_data[‘source’]/cb_data[‘x’]/cb_data[‘y’] = undefined .

How to retrieve current x,y properties in Javascript?

CODE

import pandas as pd
from bokeh.models import HoverTool, ColumnDataSource, DatetimeTickFormatter, CustomJS
from bokeh.plotting import figure, show

data = {
    "Time": ["12:03", "12:03", "12:03", "12:03", "12:12", "12:12", "12:12", "12:12", "12:17", "12:17", "12:17", "12:17"],
    "Spot": [19653, 19653, 19653, 19653, 19629, 19629, 19629, 19629, 19640, 19640, 19640, 19640],
    "Strike": [19500, 19600, 19700, 19800, 19500, 19600, 19700, 19800, 19500, 19600, 19700, 19800],
    "cLtp": [99, 174, 167, 167, 91, 165, 161, 93, 95, 16, 12, 31],
    "pLtp": [49, 24, 42, 25, 51, 74, 36, 53, 21, 29, 75, 32],
    "cSellOi": [851500, 267500, 379050, 382350, 1324350, 389700, 438850, 1318250, 1365900, 449000, 433200, 433200],
    "pSellOi": [2530350, 1615600, 1656000, 1606500, 2542100, 1598450, 1646950, 2519050, 2544450, 1488200, 1460400, 1460400],
}

df = pd.DataFrame(data)

# Convert the 'Time' column to datetime
df['Time'] = pd.to_datetime(df['Time'], format='%H:%M')
df.sort_values(by='Time', inplace=True)

source = ColumnDataSource(df)

plot = figure(
    x_axis_label="Time",
    y_axis_label="Spot",
    x_axis_type="datetime",
    title="Dataframe in Tooltip",
)

plot.line(x='Time', y='Spot', source=source, line_width=3, line_color="blue")

plot.xaxis.formatter = DatetimeTickFormatter(
    days="%Y-%m-%d",
    hours="%H:%M:%S",
    minutes="%H:%M"
)

# Create a custom JavaScript callback for the hover tool
jsHover = """
var data = source.data;
var hover = hover;
hover.tooltips = [];
var tooltipString = ""


console.log( "cb_data.source = " + cb_data['source'] );
console.log( "cb_data.value = " + cb_data['value']);
console.log( "cb_data.x/cb_data.y = " + cb_data['x'] +"/" +  cb_data['y']);

for (var i = 0; i < data['Strike'].length; i++) {
    tooltipString += data['Strike'][i] + ": (" + data['cLtp'][i] + ", " + data['pLtp'][i] + ")[";
    tooltipString += data['cSellOi'][i] + ", " + data['pSellOi'][i] + "]\\n";
}

hover.tooltips = tooltipString;

hover.change.emit();
console.log('jsHover Callback Finished');
console.log(hover.tooltips);

“”"

hoverTool = HoverTool(tooltips=None)
cb = CustomJS(args={'source': source,'hover': hoverTool}, code=jsHover)
hoverTool.callback = cb
plot.add_tools(hoverTool)
show(plot)

I don’t know what this is asking for. Do you mean the mouse position? Or do you mean the coordinates for an inspected glyph hit my the current mouse position? Please try to be specific

If the former, the documentation for HoverTool specifies what is contained in the cb_data object:

https://docs.bokeh.org/en/latest/docs/reference/models/tools.html#bokeh.models.HoverTool.callback

you can see there is a cb_data.geometry attribute for for the inspection. It’s exact form depends on the inspection mode so the simplest thing is for you to just console.log it and have a look for yourself.

If the latter, there could be multiple glyphs, and each glyphs could have multiple instances hit by one mouse position. You’ll have to use cb_data.index (also listed in the docs above) to index into all the columns of data sources that are relevant to your needs (only you know which columns these are).

cb_data[‘source’]/cb_data[‘x’]/cb_data[‘y’] = undefined

There are no “x” or “y” columns in your data frame, so there will not be any in the data source. Only you know which columns you mapped to x and y in the glyph configuration.

@srt111 I believe one issue with your code is how to get the indices in the CustomJS code. If your renderer is a line you need to use cb_data.index.line_indices in order to get the index of the data.
Not sure if the code below is what you want to display for your tooltip. Here I update the whole hover.tooltips with a new string.

jsHover = '''
var data = source.data;
var tooltipString = '';

const idx = cb_data.index.line_indices;

if (idx.length > 0) {
    console.log(cb_data);
    console.log(cb_data.index.line_indices);
    console.log(cb_data.renderer.data_source);

    const date = new Date(data['Time'][idx]);
    console.log(date);
    const timeStr = new Intl.DateTimeFormat('en-US', {hour12: false, timeZone: 'GMT-0', timeStyle: 'short'}).format(date);

    tooltipString += timeStr + ": @Spot<br>";
    for (var i = 0; i < data['Time'].length; i++) {
        if (data['Time'][i] != data['Time'][idx]) {
            continue;
        }
        tooltipString += data['Strike'][i] + ": (" + data['cLtp'][i] + ", " + data['pLtp'][i] + ")[";
        tooltipString += data['cSellOi'][i] + ", " + data['pSellOi'][i] + ") <br>";
    }
    hover.tooltips = tooltipString;
}

'''

I did try to use CustomJSHover but there I struggle to get newline \n to work.

1 Like

Thanks for the solution…but where is the dedicated documentation providing the properties/methods available for “cb_data”? .

Only “1” mention of cb_data can be found in the ‘callback’ docs.

Not sure why anyone would even consider ‘Mouse Position’ in a question which is related to invoking pandas dataframe in javascript ???

Where is the dedicated documentation providing the properties/methods available for “cb_data”? .

In 11 years of user questions, literally nothing has wasted more time than making assumptions or inadequately scoping or clarifying the problem. Not sure why anyone would think that sarcasm is a good way to encourage someone to keep donating their personal time attempting to help them for free. Best of luck, I’ll leave this question for someone else to look at.

This topic was automatically closed 90 days after the last reply. New replies are no longer allowed.