paul_c
November 14, 2022, 1:24pm
1
Hi, I have been using code like this to produce panels of charts.
charts_1 = gridplot([[ch_1, ch_2, ch_3], [ch_4, ch_5, ch_6]], sizing_mode='stretch_both', merge_tools=False)
charts_2 = gridplot([[ch_7, ch_8], [ch_9, ch_10]], sizing_mode='stretch_both', merge_tools=False)

tab1 = TabPanel(child=(layout(column(charts_1), sizing_mode='stretch_both')),title="tab1")
tab2 = TabPanel(child=(layout(column(charts_2), sizing_mode='stretch_both')),title="tab2")

tabs = Tabs(tabs=[ tab1, tab2])
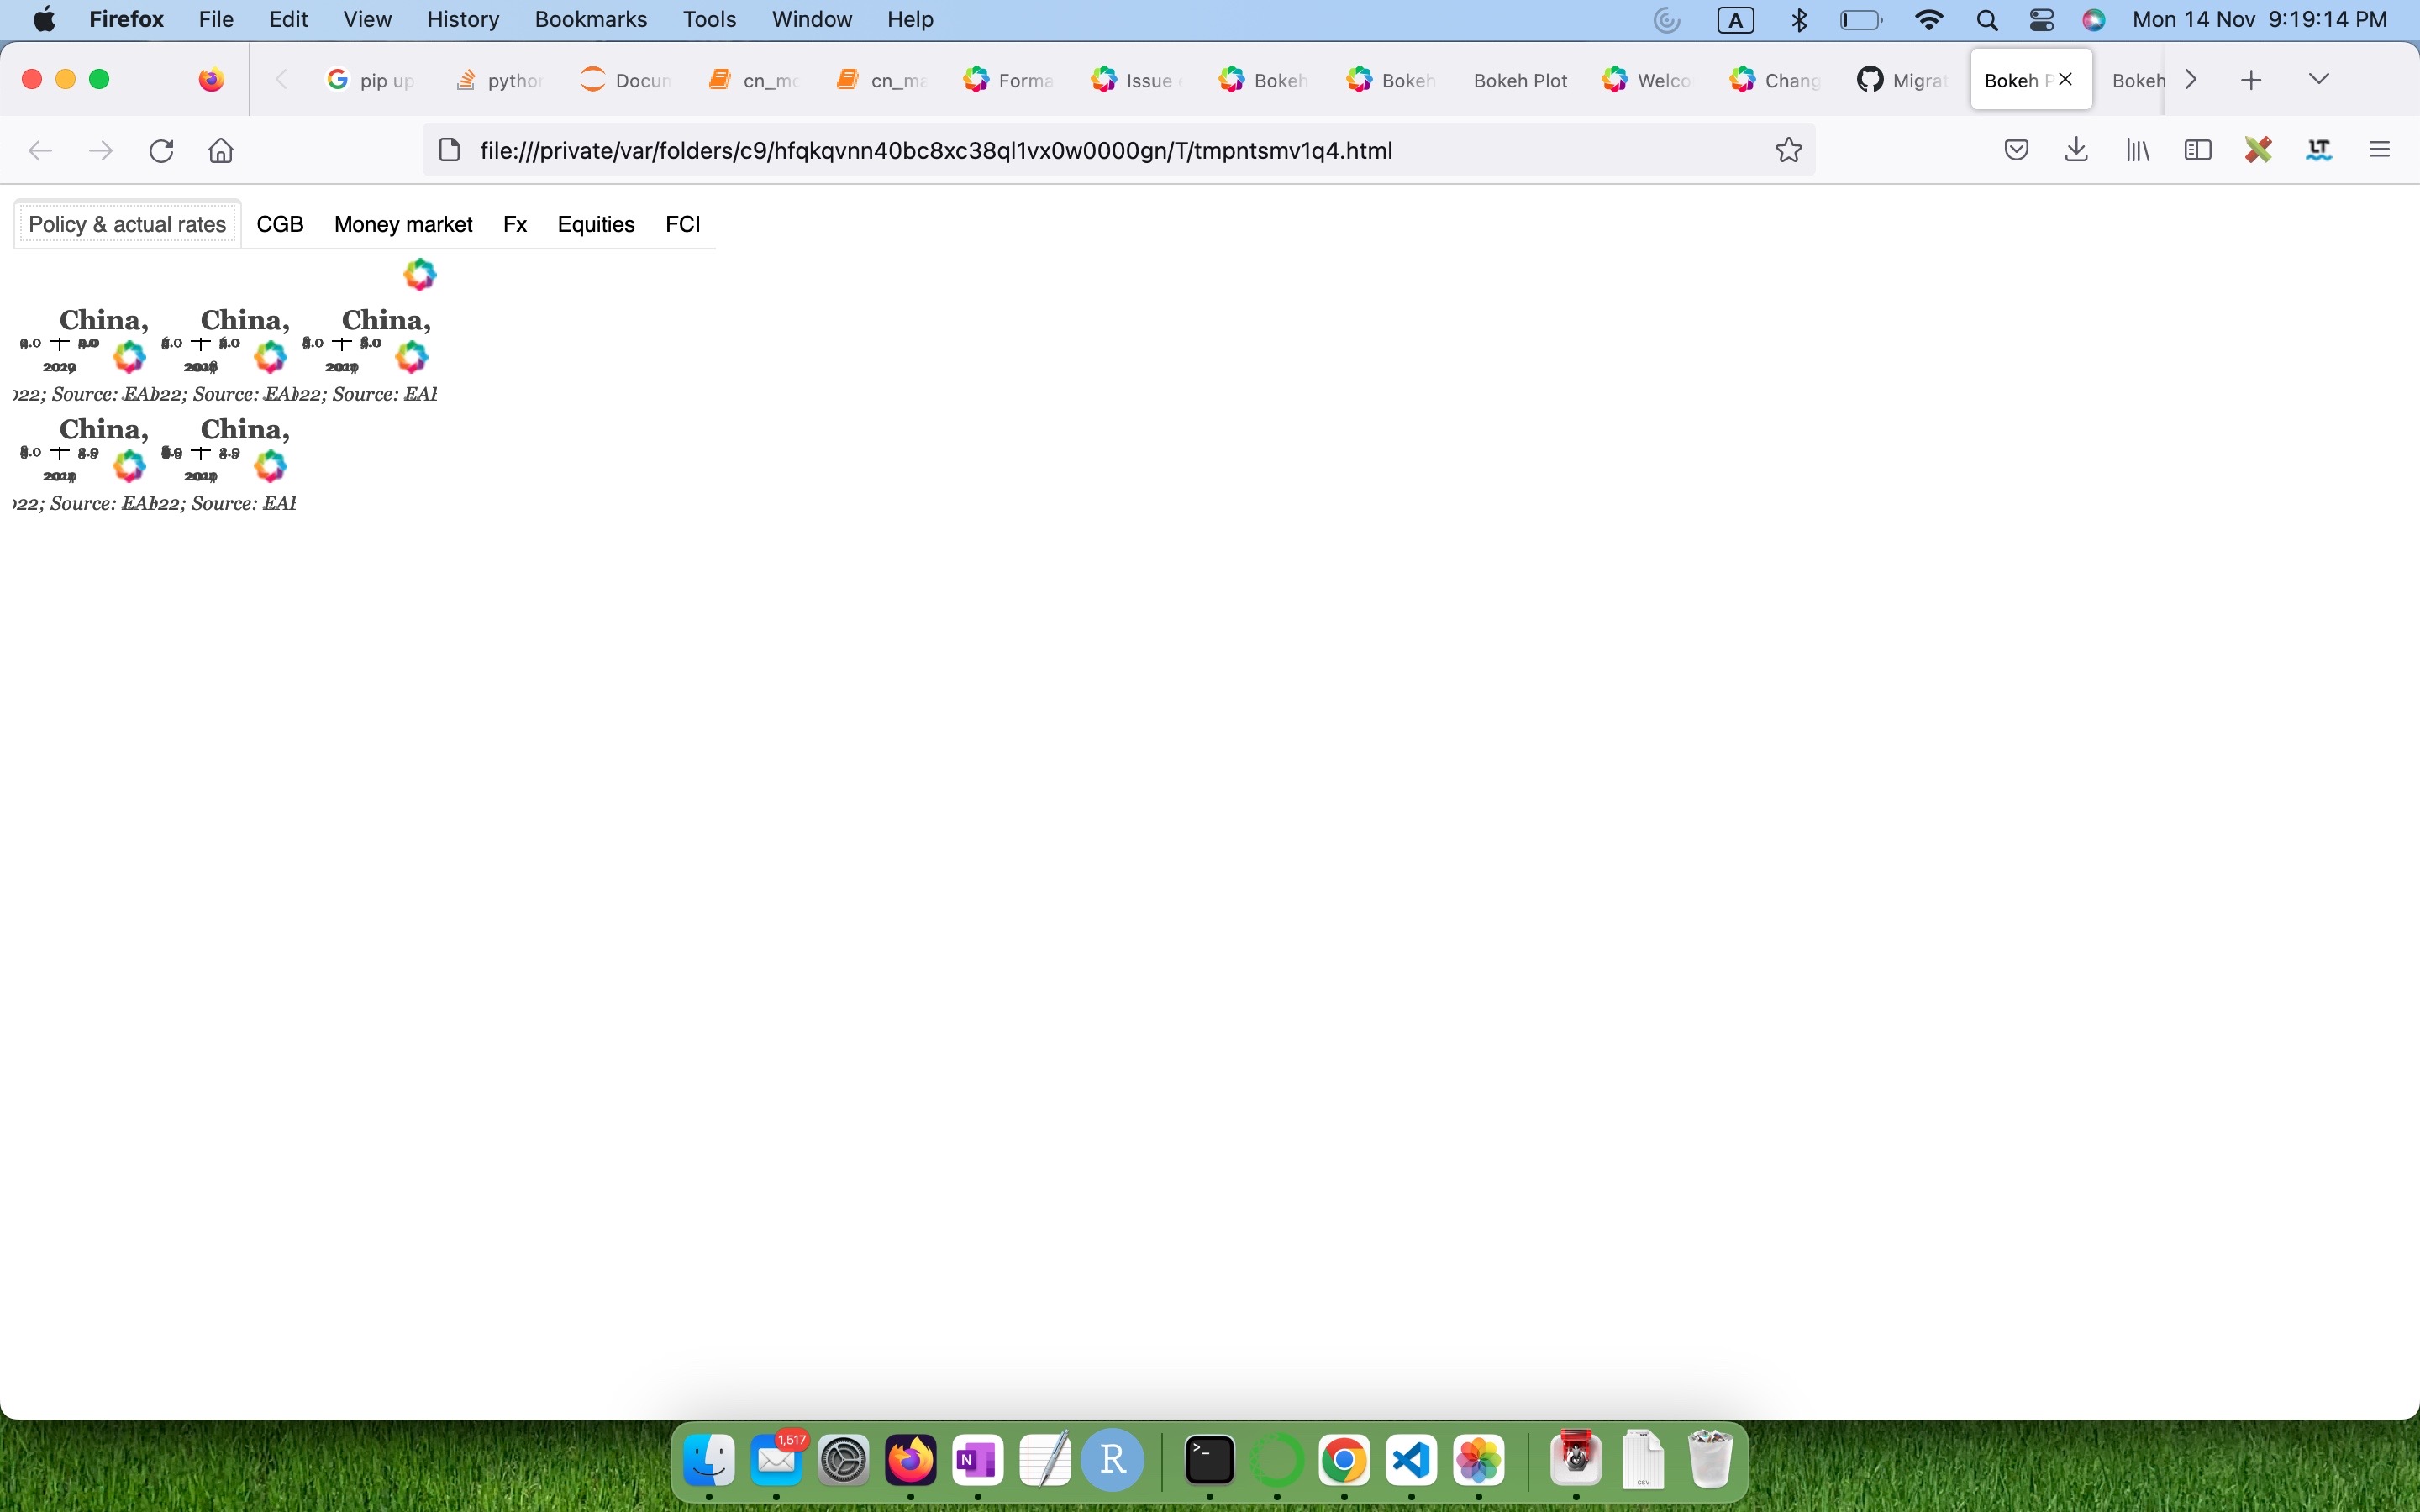
Previously, the panels would fill the screen. But after upgrading to 3.0.1, the chart sizes have drastically shrunk, as the screenshot shows. Has something changed in the new version that would explain this? Thanks
Bryan
November 14, 2022, 5:08pm
2
@mateusz is this the same issue affecting Dask? Is there an issue for this (I didn’t see one)
@paul_c can you please expand your snippet to be a complete Minimal Reproducible Example
mateusz
November 14, 2022, 6:33pm
3
It’s possibly issue [BUG] Nested gridplot collapses figures · Issue #12583 · bokeh/bokeh · GitHub , but due to a different sizing mode, this may be another problem altogether. In any case, as already said, MRE is need to investigate further.
paul_c
November 15, 2022, 4:28am
4
Thanks. Here is a MRE:
import numpy as np
import pandas as pd
from bokeh.models import ColumnDataSource
from bokeh.plotting import figure
from bokeh.layouts import gridplot, column, row, layout
from bokeh.io import show, output_notebook
from bokeh.models import TabPanel, Tabs
#from bokeh.models.widgets import Tabs, Panel

output_notebook()

dates = pd.date_range("20210101", periods=6)
df_1 = pd.DataFrame(np.random.randn(6, 4), index=dates, columns=list("ABCD"))
df_1.rename_axis('Date', axis=0, inplace=True)
source = ColumnDataSource(df_1)

s1 = figure()
s1.line(x='Date',
        y='A',
        source = source,
        color='green')

s2 = figure()
s2.line(x='Date',
        y='A',
        source = source,
        color='green')

s3 = figure()
s3.line(x='Date',
        y='A',
        source = source,
        color='green')

s4 = figure()
s4.line(x='Date',
        y='A',
        source = source,
        color='green')

grid_one = gridplot([[s1,s2], [s3,s4]], sizing_mode='stretch_both', merge_tools=False)
grid_two = gridplot([[s1,s2], [s3,s4]], sizing_mode='stretch_both', merge_tools=False)

tab1 = TabPanel(child=(layout(column(grid_one), sizing_mode='stretch_both')), title="Grid One")
tab2 = TabPanel(child=(layout(column(grid_two), sizing_mode='stretch_both')), title="Grid Two")


tabs = Tabs(tabs=[ tab1, tab2 ], css_classes=['custom_tab'])

show(tabs)
system
February 13, 2023, 4:29am
5
This topic was automatically closed 90 days after the last reply. New replies are no longer allowed.