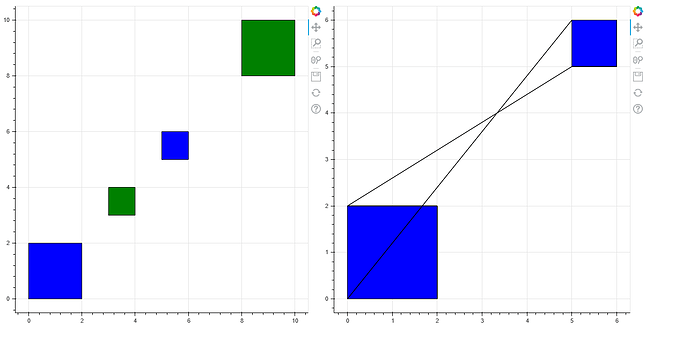
Hi, I’m getting some unexpected behaviour trying to apply a GroupFilter/CDSView to a patches renderer.
I have a collection of patches, some of which belong to the same group. Plotting these patches with no filter applied plots as intended, but when I apply a filter to say, only show ‘A’ group polygons, for some reason my separate patches are getting “stitched” together into a single patch.
See my minimal working example code below illustrating it. I’d like to use the “lower level” API (for the purpose of easier implementation of CustomJS callbacks later), so that’s why I’m using “fig1.add_glyph(glyph)” etc.
from bokeh.models import CDSView, GroupFilter, Patches,ColumnDataSource
from bokeh.plotting import figure,show
from bokeh.layouts import layout

data = {'xs':[[0,2,2,0],[3,4,4,3],[5,6,6,5],[8,10,10,8]]
        ,'ys':[[0,0,2,2],[3,3,4,4],[5,5,6,6],[8,8,10,10]]
        ,'gp':['A','B','A','B']
        ,'c':['blue','green','blue','green']}
src = ColumnDataSource(data)

#fig1 - no filter - A gp patches are blue, B are green
fig1 = figure()
glyph = Patches(xs='xs',ys='ys',fill_color='c')
r1 = fig1.add_glyph(src,glyph)

#fig2 - filter out B patches
fig2 = figure()
glyph = Patches(xs='xs',ys='ys',fill_color='c')
view = CDSView(source=src,filters=[GroupFilter(column_name='gp',group='A')])
r2 = fig2.add_glyph(src,glyph,view=view)

lo = layout([[fig1,fig2]])
show(lo)
Is this the intended behaviour? Using 2.2.3. Thanks so much!
