I’m working with some 2D datasets and I’m wondering if Bokeh supports anything like pcolormesh in matplotlib? I know there was some discussion on this at some point but I was unable to ever find a definitive answer. Any help would be greatly appreciated.
Hey,
A workaround would be to calculate the corners of each cell yourself and plot them with Bokeh’s patches. See for example (the result in the last cell):
http://nbviewer.ipython.org/urls/gist.githubusercontent.com/RutgerK/db5dbc46943989bb8a05/raw/Bokeh_colormesh
Regards,
Rutger
···
On Tuesday, May 19, 2015 at 12:35:25 AM UTC+2, Austin King wrote:
I’m working with some 2D datasets and I’m wondering if Bokeh supports anything like pcolormesh in matplotlib? I know there was some discussion on this at some point but I was unable to ever find a definitive answer. Any help would be greatly appreciated.
Thanks for the reply! Could you elaborate a little more on what you mean by calculating the corners of each cell?
···
On Tuesday, May 19, 2015 at 7:47:48 AM UTC-5, Rutger Kassies wrote:
Hey,
A workaround would be to calculate the corners of each cell yourself and plot them with Bokeh’s patches. See for example (the result in the last cell):
http://nbviewer.ipython.org/urls/gist.githubusercontent.com/RutgerK/db5dbc46943989bb8a05/raw/Bokeh_colormeshRegards,
RutgerOn Tuesday, May 19, 2015 at 12:35:25 AM UTC+2, Austin King wrote:
I’m working with some 2D datasets and I’m wondering if Bokeh supports anything like pcolormesh in matplotlib? I know there was some discussion on this at some point but I was unable to ever find a definitive answer. Any help would be greatly appreciated.
Is there something pcolormesh does that besides color mapping a scalar 2d image? If not, I think the image glyph should do what you want:
http://bokeh.pydata.org/en/latest/docs/gallery/image.html
Bryan
···
On May 19, 2015, at 12:00 PM, Austin King <[email protected]> wrote:
Thanks for the reply! Could you elaborate a little more on what you mean by calculating the corners of each cell?
On Tuesday, May 19, 2015 at 7:47:48 AM UTC-5, Rutger Kassies wrote:
Hey,A workaround would be to calculate the corners of each cell yourself and plot them with Bokeh's patches. See for example (the result in the last cell):
Jupyter Notebook ViewerRegards,
RutgerOn Tuesday, May 19, 2015 at 12:35:25 AM UTC+2, Austin King wrote:
I'm working with some 2D datasets and I'm wondering if Bokeh supports anything like pcolormesh in matplotlib? I know there was some discussion on this at some point but I was unable to ever find a definitive answer. Any help would be greatly appreciated.--
You received this message because you are subscribed to the Google Groups "Bokeh Discussion - Public" group.
To unsubscribe from this group and stop receiving emails from it, send an email to [email protected].
To post to this group, send email to [email protected].
To view this discussion on the web visit https://groups.google.com/a/continuum.io/d/msgid/bokeh/4da25392-a2ef-4eff-b92d-d8d214e7c27c%40continuum.io\.
For more options, visit https://groups.google.com/a/continuum.io/d/optout\.
Here is an example of the type of plot that I am trying to create… Basically height is the y dimension and time is the x dimension. This plot was created using pcolormesh so I was looking for something similar in Bokeh to make an interactive version of it.
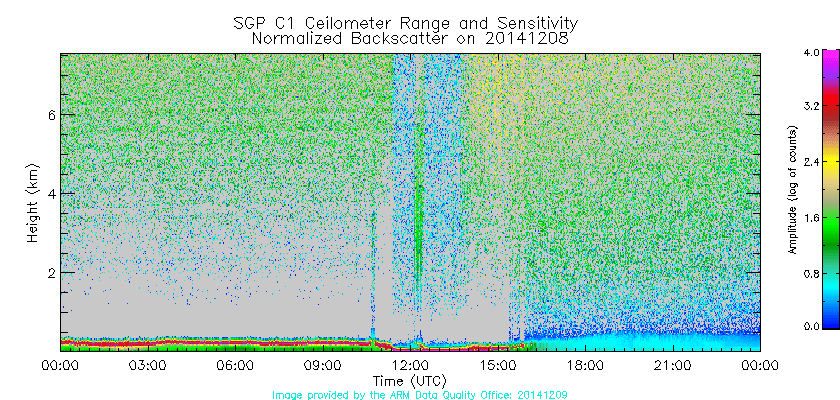
···
On Tuesday, May 19, 2015 at 12:03:03 PM UTC-5, Bryan Van de ven wrote:
Is there something pcolormesh does that besides color mapping a scalar 2d image? If not, I think the image glyph should do what you want:
[http://bokeh.pydata.org/en/latest/docs/gallery/image.html](http://bokeh.pydata.org/en/latest/docs/gallery/image.html)Bryan
On May 19, 2015, at 12:00 PM, Austin King [email protected] wrote:
Thanks for the reply! Could you elaborate a little more on what you mean by calculating the corners of each cell?
On Tuesday, May 19, 2015 at 7:47:48 AM UTC-5, Rutger Kassies wrote:
Hey,
A workaround would be to calculate the corners of each cell yourself and plot them with Bokeh’s patches. See for example (the result in the last cell):
Regards,
Rutger
On Tuesday, May 19, 2015 at 12:35:25 AM UTC+2, Austin King wrote:
I’m working with some 2D datasets and I’m wondering if Bokeh supports anything like pcolormesh in matplotlib? I know there was some discussion on this at some point but I was unable to ever find a definitive answer. Any help would be greatly appreciated.
–
You received this message because you are subscribed to the Google Groups “Bokeh Discussion - Public” group.To unsubscribe from this group and stop receiving emails from it, send an email to [email protected].
To post to this group, send email to [email protected].
To view this discussion on the web visit https://groups.google.com/a/continuum.io/d/msgid/bokeh/4da25392-a2ef-4eff-b92d-d8d214e7c27c%40continuum.io.
For more options, visit https://groups.google.com/a/continuum.io/d/optout.
That's pretty much the example I linked (a color mapped image), unless I am misunderstanding something. I'm not sure the syntax for the Bokeh image is quite as simple as pcolormesh, this would make a good candidate for a bokeh.charts high level chart some day. But I think you can get images like that now using plot.image()
Bryan
···
On May 19, 2015, at 12:08 PM, Austin King <[email protected]> wrote:
Here is an example of the type of plot that I am trying to create... Basically height is the y dimension and time is the x dimension. This plot was created using pcolormesh so I was looking for something similar in Bokeh to make an interactive version of it.
On Tuesday, May 19, 2015 at 12:03:03 PM UTC-5, Bryan Van de ven wrote:
Is there something pcolormesh does that besides color mapping a scalar 2d image? If not, I think the image glyph should do what you want:http://bokeh.pydata.org/en/latest/docs/gallery/image.html
Bryan
> On May 19, 2015, at 12:00 PM, Austin King <[email protected]> wrote:
>
> Thanks for the reply! Could you elaborate a little more on what you mean by calculating the corners of each cell?
>
>
>
> On Tuesday, May 19, 2015 at 7:47:48 AM UTC-5, Rutger Kassies wrote:
> Hey,
>
> A workaround would be to calculate the corners of each cell yourself and plot them with Bokeh's patches. See for example (the result in the last cell):
> Jupyter Notebook Viewer
>
> Regards,
> Rutger
>
> On Tuesday, May 19, 2015 at 12:35:25 AM UTC+2, Austin King wrote:
> I'm working with some 2D datasets and I'm wondering if Bokeh supports anything like pcolormesh in matplotlib? I know there was some discussion on this at some point but I was unable to ever find a definitive answer. Any help would be greatly appreciated.
>
> --
> You received this message because you are subscribed to the Google Groups "Bokeh Discussion - Public" group.
> To unsubscribe from this group and stop receiving emails from it, send an email to bokeh+un...@continuum.io.
> To post to this group, send email to bo...@continuum.io.
> To view this discussion on the web visit https://groups.google.com/a/continuum.io/d/msgid/bokeh/4da25392-a2ef-4eff-b92d-d8d214e7c27c%40continuum.io\.
> For more options, visit https://groups.google.com/a/continuum.io/d/optout\.--
You received this message because you are subscribed to the Google Groups "Bokeh Discussion - Public" group.
To unsubscribe from this group and stop receiving emails from it, send an email to [email protected].
To post to this group, send email to [email protected].
To view this discussion on the web visit https://groups.google.com/a/continuum.io/d/msgid/bokeh/291134cc-92e7-4243-b475-8a32cc3a989d%40continuum.io\.
For more options, visit https://groups.google.com/a/continuum.io/d/optout\.
Brian,
You are right that 'image' would be sufficient for Austins example. But the added benefit of MPL's pcolormesh is that the cells can be irregular, like diamond shape, and can be different for each cell (but they share the edges).
A common use case is when you want to plot a regular grid which uses a different coordinate system then the plotting figure. Pcolormesh allows you to show the data without any interpolation (to the other projection).
Regards,
Rutger
I got a basic example to work. Thanks, both of you! One last question: how can I modify the palette to emulate the default colorbar for matplotlib?
···
On Tuesday, May 19, 2015 at 12:45:30 PM UTC-5, Rutger Kassies wrote:
Brian,
You are right that ‘image’ would be sufficient for Austins example. But the added benefit of MPL’s pcolormesh is that the cells can be irregular, like diamond shape, and can be different for each cell (but they share the edges).
A common use case is when you want to plot a regular grid which uses a different coordinate system then the plotting figure. Pcolormesh allows you to show the data without any interpolation (to the other projection).
Regards,
Rutger
Hi Rutger,
I am pretty new to Python (using Anconda2 - python 2.7.11). When trying to recreate your example I am unable to execute the following import:
from tools import getAttributes #ImportError: No module named tool
I have searched around and have been unable to figure out how to find/install the tools module. Also, is the getAttributes method a call to JavaScript?
Any suggestions would be greatly appreciated!!
Damien
···
On Tuesday, May 19, 2015 at 8:47:48 AM UTC-4, Rutger Kassies wrote:
Hey,
A workaround would be to calculate the corners of each cell yourself and plot them with Bokeh’s patches. See for example (the result in the last cell):
http://nbviewer.ipython.org/urls/gist.githubusercontent.com/RutgerK/db5dbc46943989bb8a05/raw/Bokeh_colormeshRegards,
RutgerOn Tuesday, May 19, 2015 at 12:35:25 AM UTC+2, Austin King wrote:
I’m working with some 2D datasets and I’m wondering if Bokeh supports anything like pcolormesh in matplotlib? I know there was some discussion on this at some point but I was unable to ever find a definitive answer. Any help would be greatly appreciated.
Hey Damien,
Its very old code, i don’t think its the best approach for use with the current release. Since Bokeh 0.11 there is a GeoJSON datasource, which is probably the way to go, there are a few examples in the gallery using it.
I thought i could make a quick example for you, but as it turns out, i cant get it running, the examples result in an empty data-container for me ( the imported geojson string does contain data).
from bokeh.models import GeoJSONDataSource
from bokeh.sampledata.sample_geojson import geojsongeosrc = GeoJSONDataSource(geojson=geojson)
geosrc.data
I would be interested to know how this behaves for others?
The documentation for the GeoJSON datasource can be found at:
http://bokeh.pydata.org/en/server_branch/docs/user_guide/geo.html#geojson-datasource
If you want the old code used in this topic, you can find the getAttributes function in this gist. But again, i don’t recommend it:
http://nbviewer.jupyter.org/urls/gist.githubusercontent.com/RutgerK/e707239e1f82b3287a5d/raw/Bokeh_test
It was posted in the “How to create custom country maps?” thread in this mailinglist, which might also be of your interest.
https://groups.google.com/a/continuum.io/forum/#!searchin/bokeh/maps/bokeh/toseokv_xeU/76X2Ai6cz3kJ
Regards,
Rutger
···
On Tuesday, January 19, 2016 at 2:41:31 AM UTC+1, [email protected] wrote:
Hi Rutger,
I am pretty new to Python (using Anconda2 - python 2.7.11). When trying to recreate your example I am unable to execute the following import:
from tools import getAttributes #ImportError: No module named tool
I have searched around and have been unable to figure out how to find/install the tools module. Also, is the getAttributes method a call to JavaScript?
Any suggestions would be greatly appreciated!!
Damien
On Tuesday, May 19, 2015 at 8:47:48 AM UTC-4, Rutger Kassies wrote:
Hey,
A workaround would be to calculate the corners of each cell yourself and plot them with Bokeh’s patches. See for example (the result in the last cell):
http://nbviewer.ipython.org/urls/gist.githubusercontent.com/RutgerK/db5dbc46943989bb8a05/raw/Bokeh_colormeshRegards,
RutgerOn Tuesday, May 19, 2015 at 12:35:25 AM UTC+2, Austin King wrote:
I’m working with some 2D datasets and I’m wondering if Bokeh supports anything like pcolormesh in matplotlib? I know there was some discussion on this at some point but I was unable to ever find a definitive answer. Any help would be greatly appreciated.
Rutger,
Thanks for the info and quick response! I look forward to trying looking into this more tonight!
Cheers,
Damien
···
On Tue, Jan 19, 2016, 3:11 AM Rutger Kassies [email protected] wrote:
Hey Damien,
Its very old code, i don’t think its the best approach for use with the current release. Since Bokeh 0.11 there is a GeoJSON datasource, which is probably the way to go, there are a few examples in the gallery using it.
I thought i could make a quick example for you, but as it turns out, i cant get it running, the examples result in an empty data-container for me ( the imported geojson string does contain data).
from bokeh.models import GeoJSONDataSource
from bokeh.sampledata.sample_geojson import geojsongeosrc = GeoJSONDataSource(geojson=geojson)
geosrc.data
I would be interested to know how this behaves for others?
The documentation for the GeoJSON datasource can be found at:
http://bokeh.pydata.org/en/server_branch/docs/user_guide/geo.html#geojson-datasourceIf you want the old code used in this topic, you can find the getAttributes function in this gist. But again, i don’t recommend it:
http://nbviewer.jupyter.org/urls/gist.githubusercontent.com/RutgerK/e707239e1f82b3287a5d/raw/Bokeh_testIt was posted in the “How to create custom country maps?” thread in this mailinglist, which might also be of your interest.
https://groups.google.com/a/continuum.io/forum/#!searchin/bokeh/maps/bokeh/toseokv_xeU/76X2Ai6cz3kJRegards,
Rutger
On Tuesday, January 19, 2016 at 2:41:31 AM UTC+1, [email protected] wrote:
Hi Rutger,
I am pretty new to Python (using Anconda2 - python 2.7.11). When trying to recreate your example I am unable to execute the following import:
from tools import getAttributes #ImportError: No module named tool
I have searched around and have been unable to figure out how to find/install the tools module. Also, is the getAttributes method a call to JavaScript?
Any suggestions would be greatly appreciated!!
Damien
On Tuesday, May 19, 2015 at 8:47:48 AM UTC-4, Rutger Kassies wrote:
Hey,
A workaround would be to calculate the corners of each cell yourself and plot them with Bokeh’s patches. See for example (the result in the last cell):
http://nbviewer.ipython.org/urls/gist.githubusercontent.com/RutgerK/db5dbc46943989bb8a05/raw/Bokeh_colormeshRegards,
RutgerOn Tuesday, May 19, 2015 at 12:35:25 AM UTC+2, Austin King wrote:
I’m working with some 2D datasets and I’m wondering if Bokeh supports anything like pcolormesh in matplotlib? I know there was some discussion on this at some point but I was unable to ever find a definitive answer. Any help would be greatly appreciated.