Python 3.8
Bokeh 2.4.2
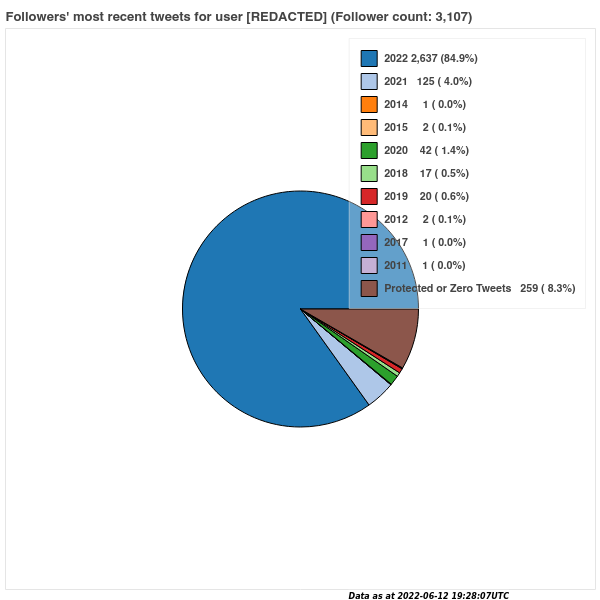
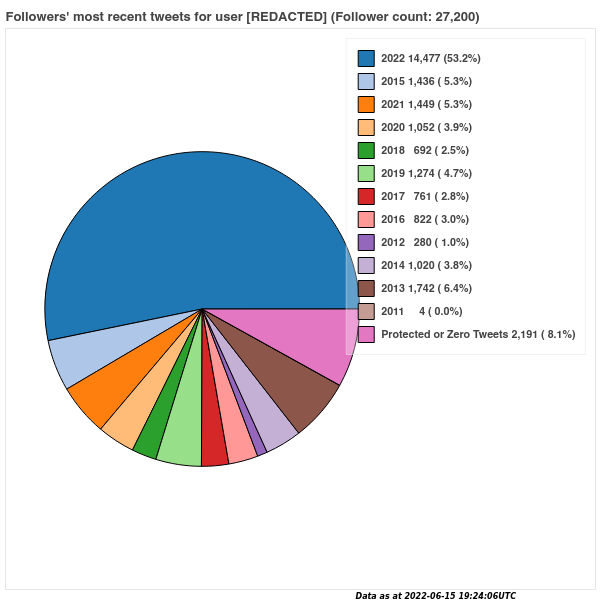
I’m generating simple Pie (Wedge) charts from Twitter follower list data, but I’m struggling to understand how to get the layout of the pie and the legend consistent, and how the data is affecting the layout.
See the two pics for what I see as inconsistency.
This is the basic code, which is hacked together from example code in the Bokeh docs. It seems to work OK except for the abovementioned (Ignore the fiddle-arsing with the pandas series stuff)
I can get the layouts correct by handcrafting width/height for each plot but obviously that’s not practical.
My preferred layout is the pie & legend side-by-side, with the pie always the same diameter & not an excess of whitespace & no overlaps
This is being saved as a png for upload & can’t be shared as embedded html.
code:
def last_tweets(x, ts):
    """Chart de poy"""

    title_text = (
        f"Followers' most recent tweets for user "
        # f"{x['user']} "
        f"[REDACTED] "
        f"(Follower count: {x['follower_count']:{len(str(x['follower_count']))},})"
    )

    title_len = len(title_text) * 7

    edate = Label(
        x=title_len - (21 * 8),
        y=0,
        x_units="screen",
        y_units="screen",
        text=f"Data as at {datetime.utcfromtimestamp(int(ts))}UTC",
        background_fill_color="white",
        text_color="black",
        text_font="dejavu sans",
        text_font_size="6pt",
        text_font_style="bold italic",
        background_fill_alpha=0.3,
    )

    colour_palette = Category20[17][: len(x["counters"])]

    data = (
        pd.Series(x["counters"])
        .reset_index(name="value")
        .rename(columns={"index": "category"})
    )

    data["angle"] = data["value"] / data["value"].sum() * 2 * PI
    data["color"] = colour_palette

    p = figure(
       # width=whatever
      # height=whatalsoever
        title=title_text,
        toolbar_location=None,
    )

    p.wedge(
        x=0,
        y=1,
        radius=0.4,
        start_angle=cumsum("angle", include_zero=True),
        end_angle=cumsum("angle"),
        line_color="black",
        fill_color="color",
        legend_field="category",
        source=data,
    )

    p.legend.label_text_font_size = "8pt"
    p.legend.label_text_font_style = "bold"
    p.legend.background_fill_alpha = 0.3
    p.axis.axis_label = None
    p.axis.visible = False
    p.grid.grid_line_color = None
    p.add_layout(edate, "below")

    # show(p)
    return p
Examples: