Hello everyone!
I’m trying to do what the subject describes: a pie chart with hover tooltips and legend outside of the plot area.
I’ve walked a long distance following the examples on the Bokeh website, Stack Overflow and some threads over here
I’m almost there but I can’t make the colors on the legend to match the colors on the pie chart. Can anyone have a look at my code and suggest me what I need to change?
Note1: The legend labels don’t appear in this example because of some problem with the plot width but I know they are correct because in my application using Bokeh server they show up
Note2: The hover tooltip is fixed in the center of the pie. I’d like it to follow the mouse but I can bear with that after so much struggling 
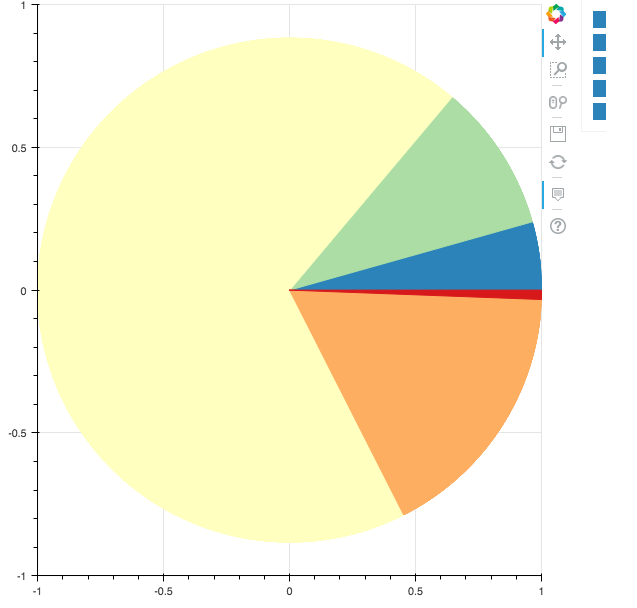
Here is the code and a screenshot of the resulting plot
from bokeh.io import curdoc
from bokeh.layouts import layout
from bokeh.models import (
HoverTool, ColumnDataSource, Legend, LegendItem
)
from bokeh.plotting import figure, show
from bokeh.palettes import brewer
from numpy import pi
starts = [0.0, 0.27429672626751683, 0.8713156234544629, 5.1821330567582686, 6.245873609350836]
ends = [0.27429672626751683, 0.8713156234544629, 5.1821330567582686, 6.245873609350836, 6.2831853071795862]
labels = [‘a’, ‘b’, ‘c’, ‘d’, ‘e’]
colors = [’#2b83ba’, ‘#abdda4’, ‘#ffffbf’, ‘#fdae61’, ‘#d7191c’]
amounts = [‘1,521,377’, ‘3,311,344’, ‘23,909,795’, ‘5,899,999’, ‘206,948’]
source=ColumnDataSource(dict(starts=starts, ends=ends, labels=labels, colors=colors, amounts=amounts))
plot = figure()
hover = HoverTool(
    tooltips=[

      ('type', '@labels'),

      ('quantity','@amounts')

    ]

)
plot.add_tools(hover)
portions =
for i in range(len(starts)):
portions.append(plot.wedge(x=0, y=0, radius=1, start_angle=‘starts’, end_angle=‘ends’, color=‘colors’, source=source))
legend_items =
for idx, portion in enumerate(portions):
legend_items.append(LegendItem(label=labels[idx], renderers=[portion]))
legend = Legend(items=legend_items, location=(40, 0))
plot.add_layout(legend, ‘right’)
layout = layout([
[plot],
])
show(plot)