I’m a relative newbie with Bokeh and I am trying to do something similar to this example – only where the widths for each edge varies with the edge weight and the colors of each edge are red if negative and black if positive. The issues I am having are:
-
The edge widths (without any interaction from clicking a node) do not all appear to line up with the actual edge weights
-
After clicking specific nodes, the width of certain edges will change, and some new edges connected to other nodes will become visible or invisible that are not supposed to (e.g., see what happens when clicking on P1, P2, P6, P12)
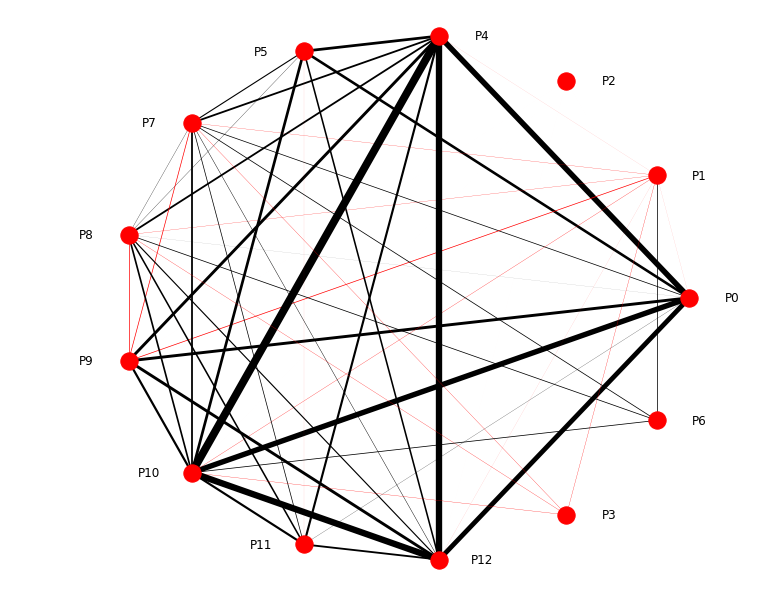
I’m including my code below which you may use to observe the behavior described above. I’ve also attached a pickle file which includes a dictionary which serves as input to the graph object (keys are the node pairs and values are the edge weights) and a picture of what this graph looks like when drawn using NetworkX
import pandas as pd
import numpy as np
import matplotlib.pyplot as plt
import networkx as nx
import pickle
from bokeh.io import show, output_file
from bokeh.models import Plot, Range1d, MultiLine, Circle, HoverTool, TapTool, BoxSelectTool
from bokeh.models.graphs import from_networkx, NodesAndLinkedEdges, EdgesAndLinkedNodes
from bokeh.palettes import Spectral4
from bokeh.plotting import figure, reset_output
from bokeh.models import ColumnDataSource, LabelSet, StaticLayoutProvider
from bokeh.models.renderers import GraphRenderer, GlyphRenderer
with open(‘pairs.pkl’, ‘rb’) as picklefile2:
pairs = pickle.load(picklefile2)
G = nx.Graph()
G.add_weighted_edges_from([(k[0], k[1], v) for k,v in pairs.items()])
for u,v in G.edges():
G[u][v]['color'] = 'red' if G[u][v]['weight'] < 0 else 'black'
pos = nx.circular_layout(G)
pos_off = {}
for k, v in pos.items():
if v[0] >= -.000001:

    pos_off[k] = (v[0] + 0.15, v[1])

else:

    pos_off[k] = (v[0] - 0.15, v[1])
plot = figure(tools="", x_range=(-1.6, 1.6),
y_range=(-1.6, 1.6), toolbar_location=None, plot_width=900, plot_height=900)
plot.add_tools(HoverTool(tooltips=None), TapTool(), BoxSelectTool())
node_ids = list(G.nodes())
start_ids = [a for a,b in G.edges()]
end_ids = [b for a,b in G.edges()]
weights = [.025*G[a][b][‘weight’] for a,b in G.edges()]
colors = [G[a][b][‘color’] for a,b in G.edges()]
graph_layout = pos_off
x = [v[0] for v in graph_layout.values()]
y = [v[1] for v in graph_layout.values()]
node_ds = ColumnDataSource(data=dict(index=node_ids,
                                 color=[Spectral4[0]]*len(list(G.nodes())),

                                 x = x,

                                 y = y),

                       name="Node Renderer")
edge_ds = ColumnDataSource(data=dict(start= start_ids,
                                  end=end_ids,

                                  weight = weights,

                                  color = colors),

                        name="Edge Renderer")
graph = GraphRenderer(node_renderer=GlyphRenderer(glyph=Circle(size=15, fill_color=“color”),
                                              #selection_glyph=Circle(size=15, fill_color="color"),

                                              data_source=node_ds),

                  edge_renderer=GlyphRenderer(glyph=MultiLine(line_alpha=0.2, line_width= 'weight', line_color = 'color'),

                                              selection_glyph=MultiLine(line_alpha=1, line_width = 'weight', line_color = 'color'),

                                              data_source=edge_ds),

                  layout_provider=StaticLayoutProvider(graph_layout=graph_layout),

                  selection_policy=NodesAndLinkedEdges())
labels = LabelSet(x=‘x’, y=‘y’, text=‘index’, source=node_ds,
background_fill_color='lightgrey')
plot.xgrid.visible=False
plot.ygrid.visible=False
plot.xaxis.visible=False
plot.yaxis.visible=False
plot.renderers.append(graph)
plot.renderers.append(labels)
show(plot)
``
Let me know if any additional information is needed and if the code above is particularly unclear. Thanks for any help/insight in advance!
pairs.pkl (1.69 KB)