Hi, all
I am completely new to HV (since last night, actually) so be gentle.
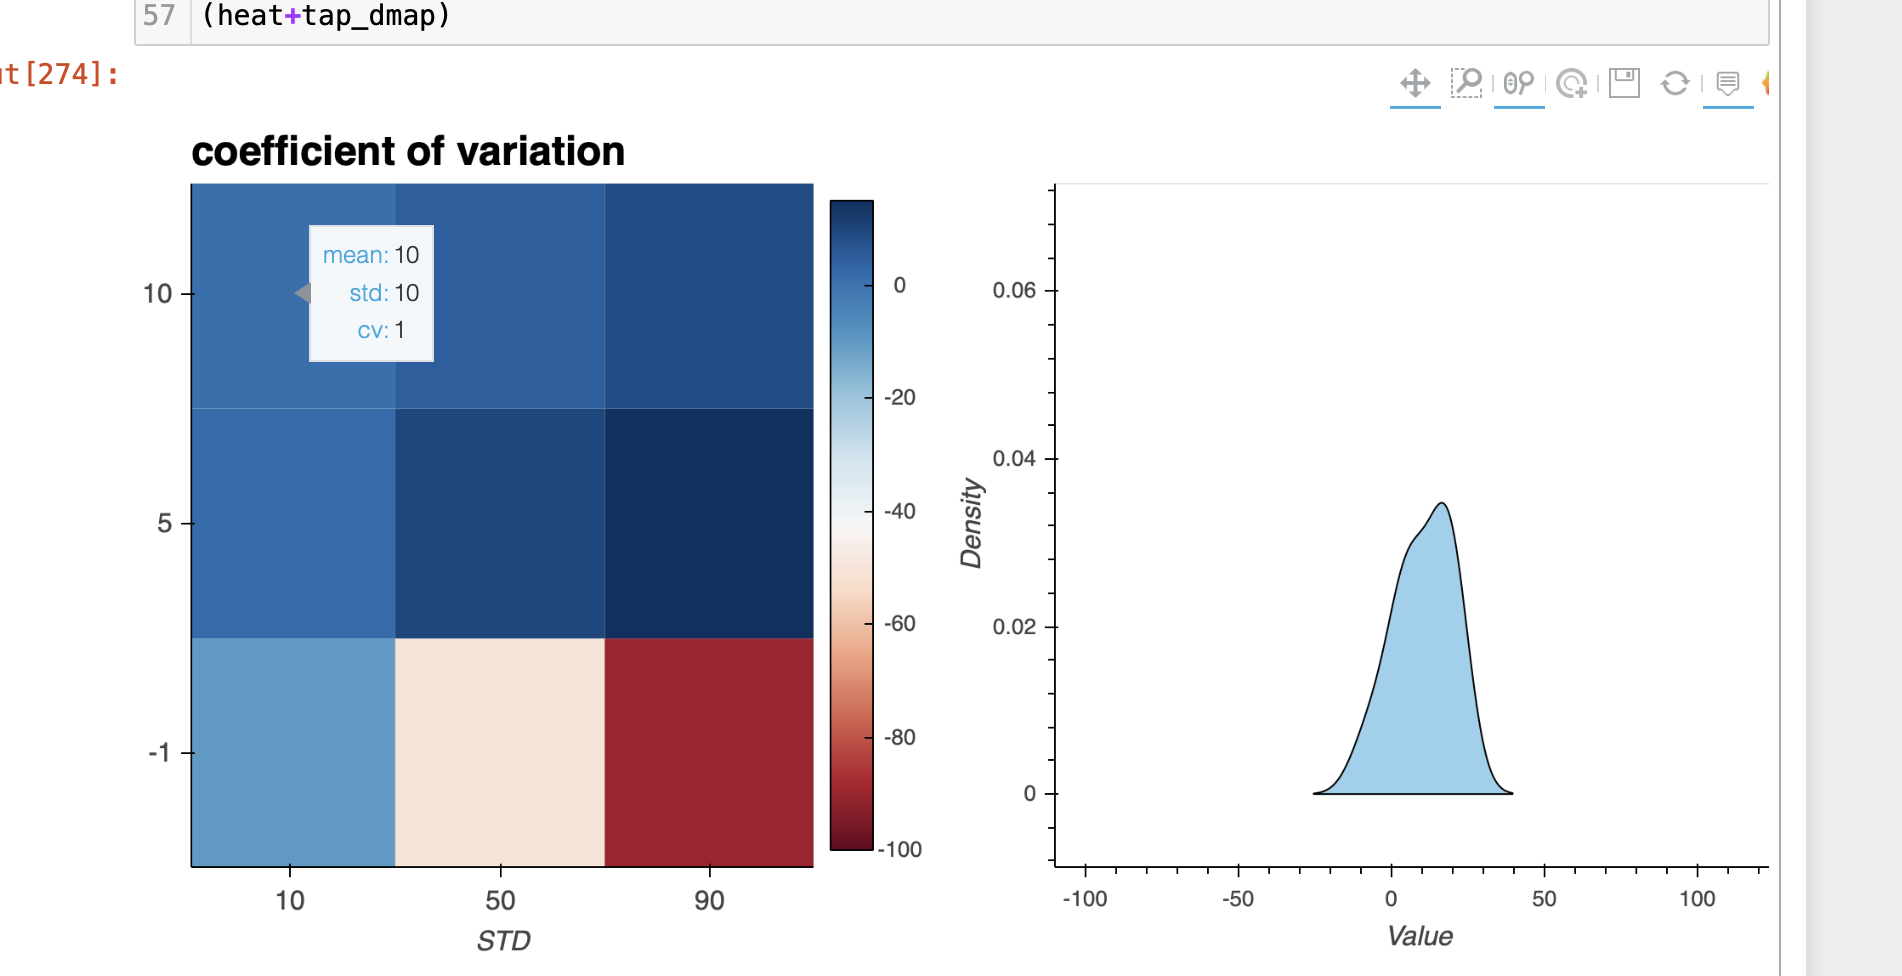
I am playing around with HV so I have constructed a heat map where x and y are some values of the mean and standard deviation (sigma). Then for each combo of mean and sigma, I calculate the coefficient of variation (just the ratio of sigma and mean). That I have successfully done.
- Now what I want to do is to, for each cell in the HeatMap, plot a gaussian that corresponds to a std and mean combo. I have no clue how to do this. Anyone has an idea? (as you can see I have tried but with no success.)
- Secondly, I have no clue how to change my hover tool to display some custom info like to say mean, std and cv instead of x, y and z
- Thirdly, how to use this HV code as a HTML (output HTML file?) so I can import it to the website?
Thanks in advance!
import pandas as pd
import numpy as np
import holoviews as hv
from holoviews import opts
hv.extension('bokeh')

# here the mean and std vales are given (hardcoded)
mu = [-1, 5, 10]
std = [10, 50, 90]

# make an empty list to append coefficient of variation
cov = []

# calculate the coefficient of variation c_v = std/mu for all combos of std and mu

for i in range(0, len(mu)):
    for j in range(0, len(std)):
        cov.append(std[j] / mu[i])

# to place the values of std and mean on a 2D plot, values have to be
# repeated in a certain way, therefore

std_rep = np.tile(std, 3)
mu_rep = np.repeat(mu, 3)

sigma = std_rep.astype(str)
mean = mu_rep.astype(str)

###heatmap entries per cell have to be strings, like this
sigma2=['10', '50', '90', '10', '50', '90', '10', '50', '90']
mean2 = ['-1', '-1', '-1', '5', '5', '5', '10', '10', '10']
################################################

# make heatmap
heatmap = hv.HeatMap((sigma, mean, cov))


# declare tap stream with heatmap as source and initial values
posxy = hv.streams.Tap(source=heatmap, x='sigma', y='mean')

# Define function to compute histogram based on tap location
def tap_histogram(x, y):

    x_vals = np.arange(-100, 100, 0.1)
    y_vals = norm(mean, sigma)

    plt.plot(x_vals, y_vals.pdf(x_vals))

    return hv.Curve((x_vals, y_vals.pdf(x_vals)), mean, sigma)


(heatmap).opts(opts.HeatMap(cmap='RdBu', tools=['hover', 'tap'], colorbar=True,
                            width=500, height=500, toolbar='above', clim=(-100,15),
                            title ='coefficient of variation',
                            fontsize={'xticks': '10pt', 'yticks': '10pt',
                                      'xlabel': '10pt', 'ylabel': '10pt',
                                     'title': '15pt'},
                            xlabel='STD', ylabel='MEAN'


                           ))

#cmap examples cmpap = 'RdBu', 'Viridis', etc
# more at http://holoviews.org/user_guide/Colormaps.html