My Goal is to create an Example of Vertical Stacked Plot Based on a ColumnDataSource from a GroupBy Object.
I read the documentation and the example on Stacked Plot and ColumnDataSource but I didn’t find any solution to my problem.
I created a short example of two sales record grouped on:
- Day 1 Day2
- Category 1 - Category 2 - Category 3
import pandas as pd
import numpy as np
today_sales={‘Day’:np.zeros(10),‘Category’:[‘Phone’,‘Appliance’,‘Appliance’,‘Phone’,“Computer”,“Computer”,“Appliance”,‘Phone’, ‘Phone’, ‘Phone’], ‘Item’:[‘Iphone’,‘Dishwasher’,‘Fridge’,‘Samsung Galaxy’,“Laptop Asus”,“Laptop Sony Vaio”,“Lavatrice Bontempi”,“Samsung Galaxy”, “Nokia 3310”, “Motorola Startac”],‘Price’:[ 350,300,599,100,900,1200,650,500, 120, 60]}
yesterday_sales={‘Day’:np.ones(10),‘Category’:[‘Phone’,‘Appliance’,‘Appliance’,‘Phone’,“Computer”,“Computer”,“Appliance”,‘Phone’, ‘Phone’, ‘Phone’], ‘Item’:[‘Ericson T10’,‘Pinguino DeLonghi’,‘Freezer’,‘Motorola Razr’,“Laptop HP”,“Laptop Acer”,“Lavatrice Bontempi”,“Iphone”, “Nokia 3330”, “Motorola Startac”],‘Price’:[ 150,200,699,100,400,600,650,350, 120, 60]}
df_sales_today=pd.DataFrame(today_sales)
df_sales_yesterday=pd.DataFrame(yesterday_sales)
sales_two_day=df_sales_today.append(df_sales_yesterday)
two_day_category_sum=sales_two_day.groupby([‘Day’,‘Category’]).sum()
``
then I imported all the module that I needed
from bokeh.models import ColumnDataSource, Plot
from bokeh.models.glyphs import VBar
from bokeh.plotting import figure,curdoc
from bokeh.io import show,push_notebook, output_notebook,output_file
output_notebook()
``
And then I get stuck here:
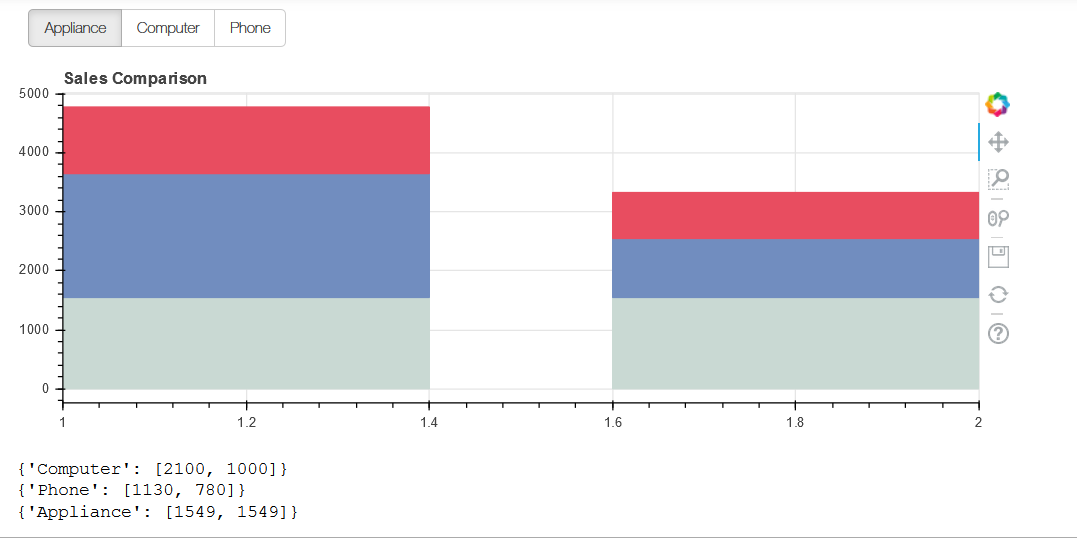
p=figure(plot_height=250, title=‘Sales Comparison’)
data=ColumnDataSource(two_day_category_sum)
p.vbar_stack(x=‘Day_Category’,source=data, width=0.9)
show(p)
``
What is missing is the ‘Stackers’.
TypeError: vbar_stack() missing 1 required positional argument: 'stackers'

And It makes sense because I don't Know how to select.

The X should be "today" (1) and "Yesterday"(2) and on the vertical bar I would like to have the stack of the three categories

Thanks! :)