HI,
I have Plot which is generating correct but display is not coming,can u please guide me
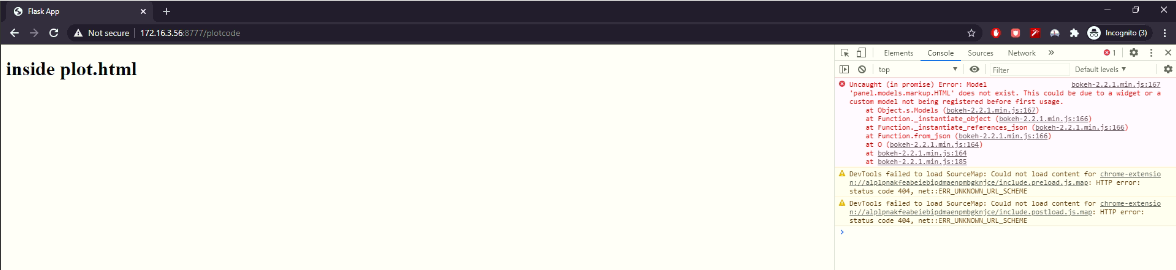
header tag is displaying but plot is not displaying.
Error in console:-
bokeh-2.2.1.min.js:167 Uncaught (in promise) Error: Model 'panel.models.markup.HTML' does not exist. This could be due to a widget or a custom model not being registered before first usage.
    at Object.s.Models (bokeh-2.2.1.min.js:167)
    at Function._instantiate_object (bokeh-2.2.1.min.js:166)
    at Function._instantiate_references_json (bokeh-2.2.1.min.js:166)
    at Function.from_json (bokeh-2.2.1.min.js:166)
    at O (bokeh-2.2.1.min.js:164)
    at bokeh-2.2.1.min.js:164
    at bokeh-2.2.1.min.js:185
log file detail below :-
is panel making some error ?
[Tue Sep 22 05:23:05.690933 2020] [wsgi:error] [pid 17392:tid 1420] [client 172.16.3.56:62979] WARNING:param.GeoOverlayPlot04481: The finalize_hooks option is deprecated, use the hooks option instead.\r
[Tue Sep 22 05:23:05.802899 2020] [wsgi:error] [pid 17392:tid 1420] [client 172.16.3.56:62979] cdn_js: https://cdn.bokeh.org/bokeh/release/bokeh-widgets-2.2.1.min.js\r
[Tue Sep 22 05:23:05.802899 2020] [wsgi:error] [pid 17392:tid 1420] [client 172.16.3.56:62979] cdn_css []\r
[Tue Sep 22 05:23:11.182970 2020] [authz_core:debug] [pid 17392:tid 1416] mod_authz_core.c(815): [client 172.16.3.56:62995] AH01626: authorization result of Require all granted: granted
[Tue Sep 22 05:23:11.182970 2020] [authz_core:debug] [pid 17392:tid 1416] mod_authz_core.c(815): [client 172.16.3.56:62995] AH01626: authorization result of <RequireAny>: granted
[Tue Sep 22 05:23:11.183996 2020] [authz_core:debug] [pid 17392:tid 1416] mod_authz_core.c(815): [client 172.16.3.56:62995] AH01626: authorization result of Require all granted: granted
[Tue Sep 22 05:23:11.183996 2020] [authz_core:debug] [pid 17392:tid 1416] mod_authz_core.c(815): [client 172.16.3.56:62995] AH01626: authorization result of <RequireAny>: granted
[Tue Sep 22 05:23:14.130984 2020] [wsgi:error] [pid 17392:tid 1416] [client 172.16.3.56:62995] types of finalplot: <class 'panel.layout.Column'>\r
[Tue Sep 22 05:23:14.139983 2020] [wsgi:error] [pid 17392:tid 1416] [client 172.16.3.56:62995] finalplot: Column\r
[Tue Sep 22 05:23:14.139983 2020] [wsgi:error] [pid 17392:tid 1416] [client 172.16.3.56:62995]     [0] Row\r
[Tue Sep 22 05:23:14.139983 2020] [wsgi:error] [pid 17392:tid 1416] [client 172.16.3.56:62995]         [0] HoloViews(Div)\r
[Tue Sep 22 05:23:14.139983 2020] [wsgi:error] [pid 17392:tid 1416] [client 172.16.3.56:62995]         [1] HoloViews(Div)\r
[Tue Sep 22 05:23:14.139983 2020] [wsgi:error] [pid 17392:tid 1416] [client 172.16.3.56:62995]     [1] Row\r
[Tue Sep 22 05:23:14.139983 2020] [wsgi:error] [pid 17392:tid 1416] [client 172.16.3.56:62995]         [0] HoloViews(DynamicMap)\r
[Tue Sep 22 05:23:14.139983 2020] [wsgi:error] [pid 17392:tid 1416] [client 172.16.3.56:62995]         [1] Column\r
[Tue Sep 22 05:23:14.139983 2020] [wsgi:error] [pid 17392:tid 1416] [client 172.16.3.56:62995]             [0] WidgetBox\r
[Tue Sep 22 05:23:14.139983 2020] [wsgi:error] [pid 17392:tid 1416] [client 172.16.3.56:62995]                 [0] Select(margin=(20, 20, 5, 20), options=['2019-07-04 00:00:00', ...], value='2019-07-04 00:00:00', width=250)\r
[Tue Sep 22 05:23:14.139983 2020] [wsgi:error] [pid 17392:tid 1416] [client 172.16.3.56:62995]                 [1] Select(margin=(5, 20, 20, 20), options=['Andra_Pradesh', ...], value='Andra_Pradesh', width=250)\r
[Tue Sep 22 05:23:14.139983 2020] [wsgi:error] [pid 17392:tid 1416] [client 172.16.3.56:62995]             [1] VSpacer()
[Tue Sep 22 05:23:14.139983 2020] [wsgi:error] [pid 17392:tid 1416] [client 172.16.3.56:62995] \r
[Tue Sep 22 05:23:14.352911 2020] [wsgi:error] [pid 17392:tid 1416] [client 172.16.3.56:62995] WARNING:param.TilePlot06799: The finalize_hooks option is deprecated, use the hooks option instead.\r
[Tue Sep 22 05:23:14.684809 2020] [wsgi:error] [pid 17392:tid 1416] [client 172.16.3.56:62995] WARNING:param.GeoRasterPlot06816: Supply either hooks or finalize_hooks not both, using hooks and ignoring finalize_hooks.\r
[Tue Sep 22 05:23:14.691804 2020] [wsgi:error] [pid 17392:tid 1416] [client 172.16.3.56:62995] WARNING:param.RGBPlot06833: Supply either hooks or finalize_hooks not both, using hooks and ignoring finalize_hooks.\r
[Tue Sep 22 05:23:14.704799 2020] [wsgi:error] [pid 17392:tid 1416] [client 172.16.3.56:62995] WARNING:param.GeoOverlayPlot06734: The finalize_hooks option is deprecated, use the hooks option instead.\r
[Tue Sep 22 05:23:14.731791 2020] [wsgi:error] [pid 17392:tid 1416] [client 172.16.3.56:62995] WARNING:param.TilePlot06799: The finalize_hooks option is deprecated, use the hooks option instead.\r
[Tue Sep 22 05:23:15.055690 2020] [wsgi:error] [pid 17392:tid 1416] [client 172.16.3.56:62995] WARNING:param.GeoRasterPlot06816: Supply either hooks or finalize_hooks not both, using hooks and ignoring finalize_hooks.\r
[Tue Sep 22 05:23:15.057689 2020] [wsgi:error] [pid 17392:tid 1416] [client 172.16.3.56:62995] WARNING:param.RGBPlot06833: Supply either hooks or finalize_hooks not both, using hooks and ignoring finalize_hooks.\r
[Tue Sep 22 05:23:15.062656 2020] [wsgi:error] [pid 17392:tid 1416] [client 172.16.3.56:62995] WARNING:param.GeoOverlayPlot06734: The finalize_hooks option is deprecated, use the hooks option instead.\r
[Tue Sep 22 05:23:15.126659 2020] [wsgi:error] [pid 17392:tid 1416] [client 172.16.3.56:62995] cdn_js: https://cdn.bokeh.org/bokeh/release/bokeh-widgets-2.2.1.min.js\r
[Tue Sep 22 05:23:15.126659 2020] [wsgi:error] [pid 17392:tid 1416] [client 172.16.3.56:62995] cdn_css []\r
app.py code is below 
@app.route(’/plotcode’)
def plot():
from datetime import timedelta
import time
strtt = time.time()
datamat = loadmat('D:/Apache2_Projects/plot/newtest_Tm02.mat').......
 tiles = gv.tile_sources.Wikipedia
hmap1 = hv.HoloMap(allplot, kdims=['Select Date and Time :', 'Select Indian State'])

dd = df_div.opts(width=70, height=70)
dd1 = df_div1.opts(width=600, height=90)

finalplot = pn.Column(pn.Row(dd, dd1),
                      tiles * rasterize(hmap1).options(**opts) * logo1.opts(hooks=[absolute_position],
                                                                            apply_ranges=False))
print("types of finalplot:", type(finalplot))
print("finalplot:", finalplot)
# print("--- %s seconds ---" % (time.time() - strtt))
from bokeh.embed import components
from bokeh.resources import CDN
from bokeh.io import curdoc
doc = curdoc()
script, div = components(finalplot.get_root(doc))
cdn_js0 = CDN.js_files[0]
cdn_js = CDN.js_files[1]
cdn_css = CDN.css_files
print("cdn_js:", cdn_js)
print("cdn_css", cdn_css)

return render_template("plot.html",
                       script=script,
                       div=div,
                       cdn_css=cdn_css,
                       cdn_js=cdn_js,
                       cdn_js0=cdn_js0)
plot.html
{%extends "layout.html"%}
{%block content%}
<script type="text/javascript" src={{cdn_js0 | safe}}></script>
<script type="text/javascript" src={{cdn_js | safe}}></script>
<h1>inside plot.html</h1>
{{script | safe}}
{{div | safe}}
{%endblock%}
Kindly let me know why the plot is not coming in browser and how to display it.
Thank u.