Hi all,
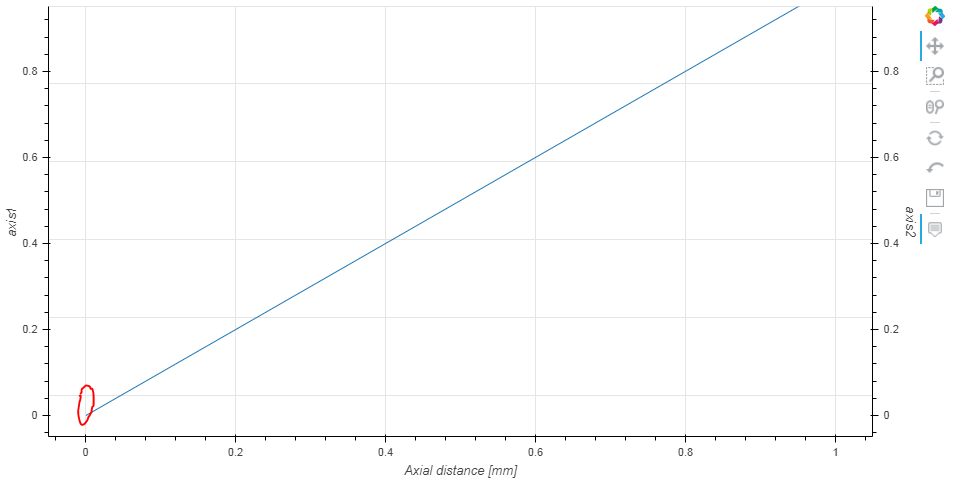
I have this plot and the horizontal grid automatically generated doesn’t start at 0, do you know ho to fix this?
I have Bokeh 2.2.3 and python 3.6 on windows 7
from bokeh.plotting import figure
from bokeh.models import Range1d, LinearAxis
from bokeh.io import show

graph2D = figure(height=480, width=950, tools="pan,box_zoom,wheel_zoom,hover,reset,undo,save")
graph2D.xaxis.axis_label = 'Axial distance [mm]'
graph2D.yaxis.visible = False
graph2D.extra_y_ranges = dict(left=Range1d(start=0, end=1), right=Range1d(start=0, end=1))
graph2D.add_layout(LinearAxis(y_range_name="left", axis_label="axis1"), 'left')
graph2D.add_layout(LinearAxis(y_range_name="right", axis_label="axis2"), 'right')
graph2D.line(x=[0,1], y=[0,1], y_range_name='left')

show(graph2D)
Many thanks