Plot labels disappear when y-axis is logarithmic and max-y is specified

I’m trying to do some box and whisker plots, using this an an example:

But in my eventual need, with my data, I will need a logarithmic y-axis and also need to set the maximum y-value as well, using:

           y_axis_type="log",
           y_range=(0,100),

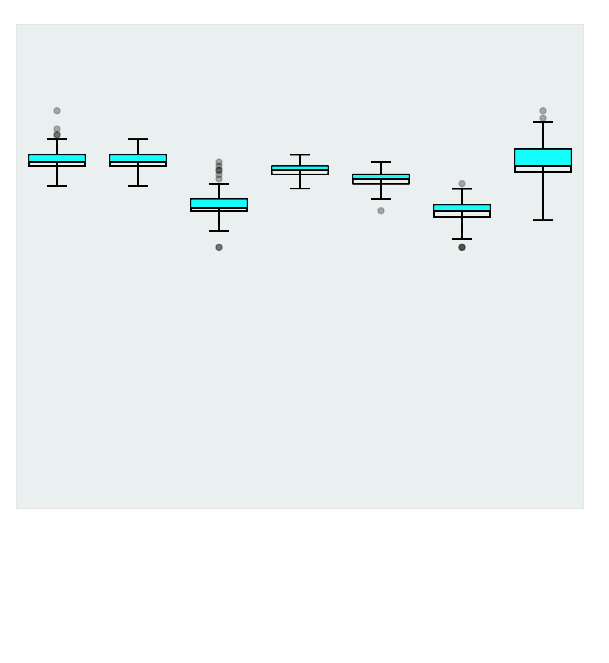
But when I do both of those the labels for my x and y-axis disappear! See the following plot where the labels are missing. This only happens when BOTH the lines above are in force. In all other cases the x and y labels are on the plot. Anyone have any ideas? Thanks.

I could only include one plot. Here is an example with only logarithmic y-axis.

Odd. But I discovered a solution to the above problem. Make the y-range not start at zero, even if only a tiny bit above zero. Like this:

y_range=(0.1, 100),

If anyone knows why, it would be nice to know. But at least my plots work again.

If you are using logarithmic axes then your minimum range value should always be a positive number. The logarithm of zero is minus infinity.

This topic was automatically closed 90 days after the last reply. New replies are no longer allowed.