Hi,
I dont understand why my plot is overlaying on top of each other when I run my script on the server.
When a user clicks a button it causes an event to happen to calculate the area under the graph and adds a new label. Snippet of code:
        area = trapz(dfModelFlux.flux, dfModelFlux.time/24, dx=5)
        print("area =", area)
        pFlux.varea(x = dfModelFlux.time,
                y1 = (10e-10)*dfModelFlux.flux,
                y2 = dfModelFlux.flux,
                legend_label = 'Power Law Flux, Area = ' + str(round(area, 2)) + ' mg',
                fill_color = 'black')
        pFlux.legend.click_policy = 'hide'

        l.children[4].tabs[3].child.children[0].children[0] =  pFlux
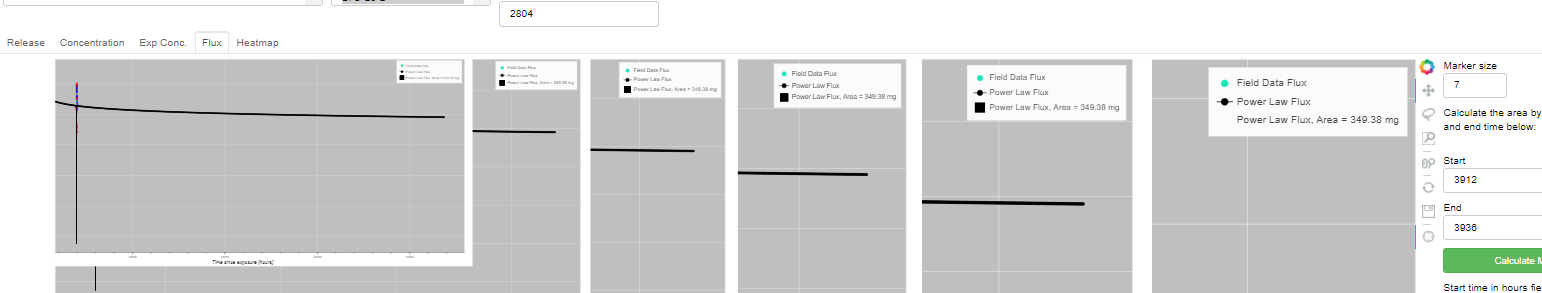
This works fine when I work locally on my computer. I get this:
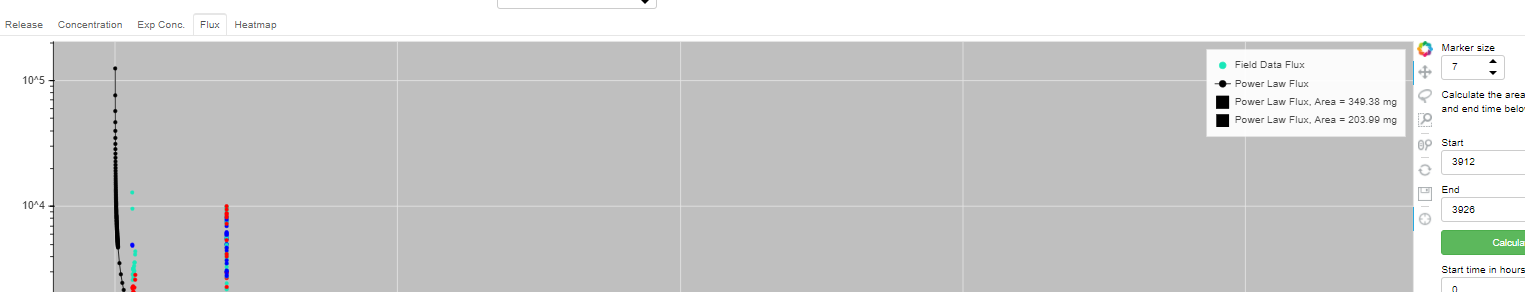
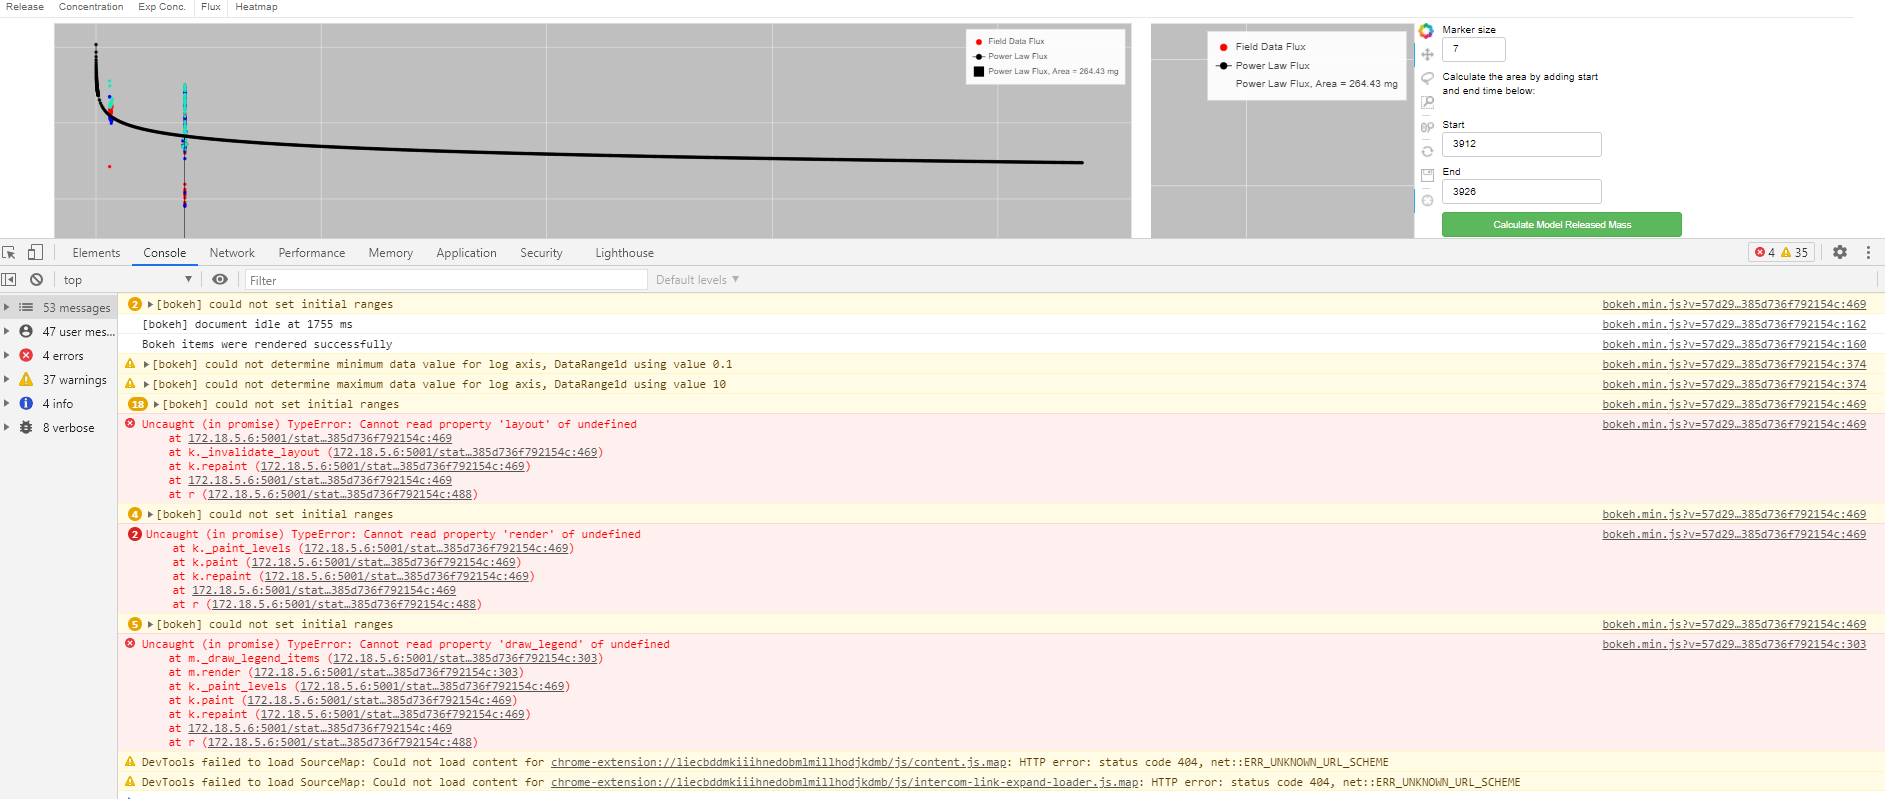
But pushing the same changes to a seperate Ubuntu server with same Bokeh version. I get this when the user clicks the button. Anyone know what the issue can be?