On May 31, 2017, at 11:40, 'Giles Harper-Donnelly' via Bokeh Discussion - Public <[email protected]> wrote:
Hi Bryan,
Thanks so much for such a speedy response and for your suggestions. The change in length of tick labels makes lots of sense, I will have a play around with margins and tick formatters.
The truncation of tick labels still occurs even when the default option in the color selector is petal_length (and so the first time the plot is made the ticks on the colorbar are the short length, if that is how it works). Might this suggest a root cause of something going wrong when the space the colorbar needs is calculated?
Happy to open a GH issue if you reckon it's worth.
Thanks again,
Giles
On Wednesday, May 31, 2017 at 4:57:40 PM UTC+1, Bryan Van de ven wrote:
Hi,
Well the proximate cause is that the length of the tick labels on the color bar are changing. The layout change occurs precisely when the longer labels with decimals show up or disappear. For a static plot and many dynamic plots this automatic adjustment is what is desired to give the plot the most amount of space, but can obviously not be great in a few situations as you demonstrate.
Unfortunately the axis on the color bar is not currently as configurable as regular plot axes. It's not currently possible to change the orientation of the labels to vertical (which would solve the problem because they would always take up the same amount of space in the horizontal direction) nor is there a "min_border" setting that would allow you to set the min border to be larger than the largest expected tick. Given that, I can suggest a few possible other approaches:
* make the entire colorbar horizontal (e.g. above or below the plot) so that the labels don't grow in the direction normal to the colorbar side.
* increasing .margin on the colorbar *may* help, but I am not certain
* set a different tick formatter on the colorbar, that always formats the ticks to have exactly the same length (e.g. shows "2.0" instead of "2" so that there is always one place after the decimal)
Not great, but those are the only things I can think of that would help at the moment. It's also probably worth a GH issue to discuss possible improvements to make the colorbar axis more configurable.
Thanks,
Bryan
> On May 31, 2017, at 10:38, 'Giles Harper-Donnelly' via Bokeh Discussion - Public <[email protected]> wrote:
>
> Hi,
>
> I am experiencing some funny behaviour when trying to control the color of glyphs using a select widget.
>
>
>
>
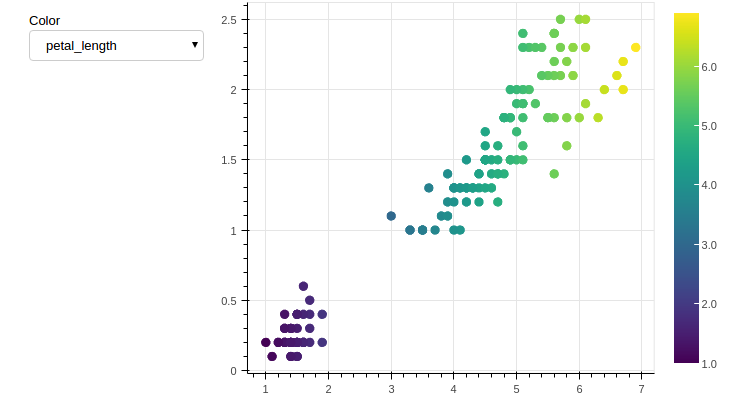
> The size of the plot changes when petal_length is chosen to color the glyphs. This does not occur when any other feature is used for the color.
>
>
> The code for on_change function of the color widget (below) updates the 'color' column in the source as well as changing the limits of the color mapper used, and so I am surprised that the dimensions of the plots are affected.
>
> def
> update_color(attr, old, new):
> source.data.update({'color': df[color_select.value]})
> color_mapper.high = df[color_select.value].max()
> color_mapper.low = df[color_select.value].min()
>
>
>
> All the code:
> iris_color_select.py · GitHub
>
> bokeh version: 0.12.5
> python 3.5.3
> Reproducible in both firefox and chrome, as well as inside the jupyter notebook.
>
> Any help would be much appreciated (as well as advice on methods for updating color in general).
>
> Cheers,
> Giles
>
> --
> You received this message because you are subscribed to the Google Groups "Bokeh Discussion - Public" group.
> To unsubscribe from this group and stop receiving emails from it, send an email to bokeh+un...@continuum.io.
> To post to this group, send email to bo...@continuum.io.
> To view this discussion on the web visit https://groups.google.com/a/continuum.io/d/msgid/bokeh/8e3c23f7-0b24-4851-b1ca-23bdabdb1b80%40continuum.io\.
> For more options, visit https://groups.google.com/a/continuum.io/d/optout\.
--
You received this message because you are subscribed to the Google Groups "Bokeh Discussion - Public" group.
To unsubscribe from this group and stop receiving emails from it, send an email to [email protected].
To post to this group, send email to [email protected].
To view this discussion on the web visit https://groups.google.com/a/continuum.io/d/msgid/bokeh/ce6cd2e9-f4fc-4f02-a4fa-f874cb7017b6%40continuum.io\.
For more options, visit https://groups.google.com/a/continuum.io/d/optout\.