I am starting with bokeh and I wonder if anyone could point me in the right direction.
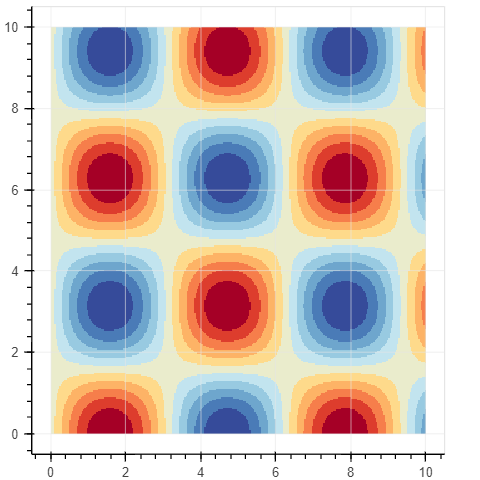
I have an image (2D array). Using the gallery example:
import numpy as np

from bokeh.plotting import figure, show
from bokeh.models import ColumnDataSource, RangeTool
from bokeh.layouts import column

x = np.linspace(0, 10, 300)
y = np.linspace(0, 10, 300)
xx, yy = np.meshgrid(x, y)
d = np.sin(xx) * np.cos(yy)

# Figures creation
im_fig = figure(width=400, height=400)

# Plotting the data
im_fig.image(image=[d], x=0, y=0, dw=10, dh=10, palette="Sunset11", level="image")
im_fig.grid.grid_line_width = 0.5

show(im_fig)
Which results in:
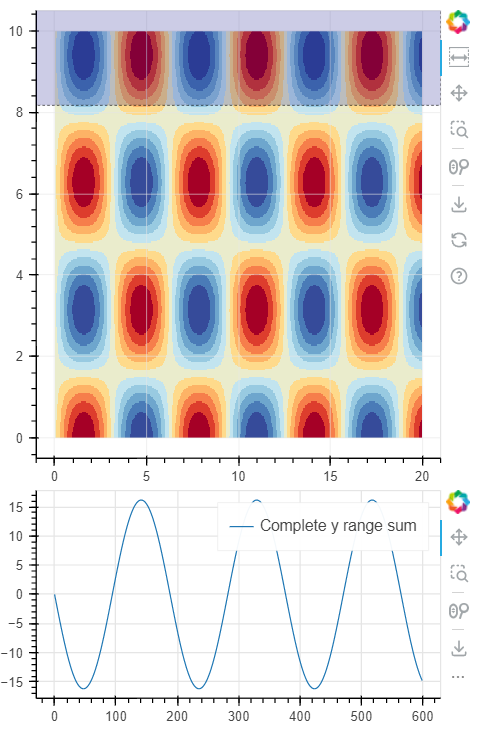
Now I would like to sum the data along a y selection and plot it in another figure. This seems to be the work of the RangeTool.
I create another figure to plot the summed data of the selection but I get an error while adding the initial range:
import numpy as np

from bokeh.plotting import figure, show
from bokeh.models import ColumnDataSource, RangeTool
from bokeh.layouts import column

x = np.linspace(0, 10, 300)
y = np.linspace(0, 10, 300)
xx, yy = np.meshgrid(x, y)
d = np.sin(xx) * np.cos(yy)

# Figures creation
im_fig = figure(width=400, height=400)
sum_fig = figure(width=400, height=200)

# Plotting the data
im_fig.image(image=[d], x=0, y=0, dw=10, dh=10, palette="Sunset11", level="image")
im_fig.grid.grid_line_width = 0.5

# Adding the range tools
range_tool = RangeTool(y_range=im_fig.y_range)
range_tool.overlay.fill_color = "navy"
range_tool.overlay.fill_alpha = 0.2
im_fig.add_tools(range_tool)
im_fig.toolbar.active_multi = range_tool

show(column(im_fig, sum_fig))
This is the error:
failed to validate RangeTool(id='p1108', ...).y_range: expected either None or a value of type Instance(Range1d), got DataRange1d(id='p1003', ...)
My guess, this is happening because the Range tool is not compatible with the Image glyph. I wonder if anyone could please point me towards the right direction. Ty.