Hello,
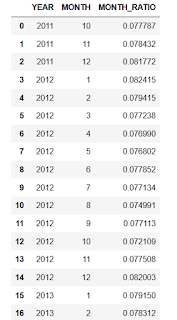
Relatively new to Bokeh, I have an aggregated Dataframe M as in the picture.
3 columns, One column for Year one Column for month and one column for monthly ratio.
I want to plot a line in Bokeh with month progression on the X axis categorized by year vs
month_ratio on Y axis. Like a continuous progression of months categorized by year. something like
X-axis : 10 11 12 | 1 2 3 4 5 6 7 8 9 10 11 12 | 1 2
2011 2012 2013
Y axis : MONTH RATIO
Any ideas how to do that ?
