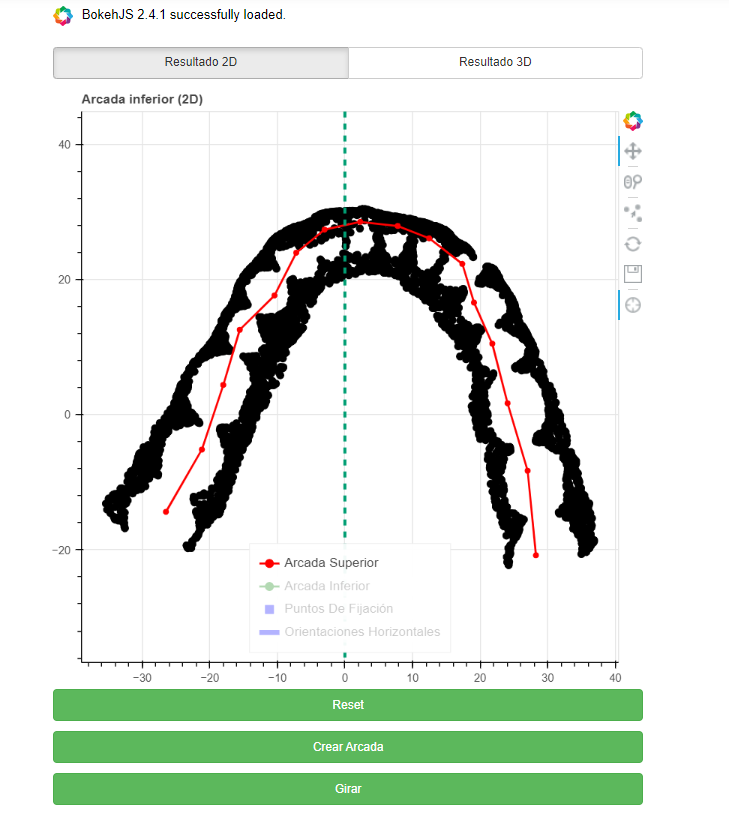
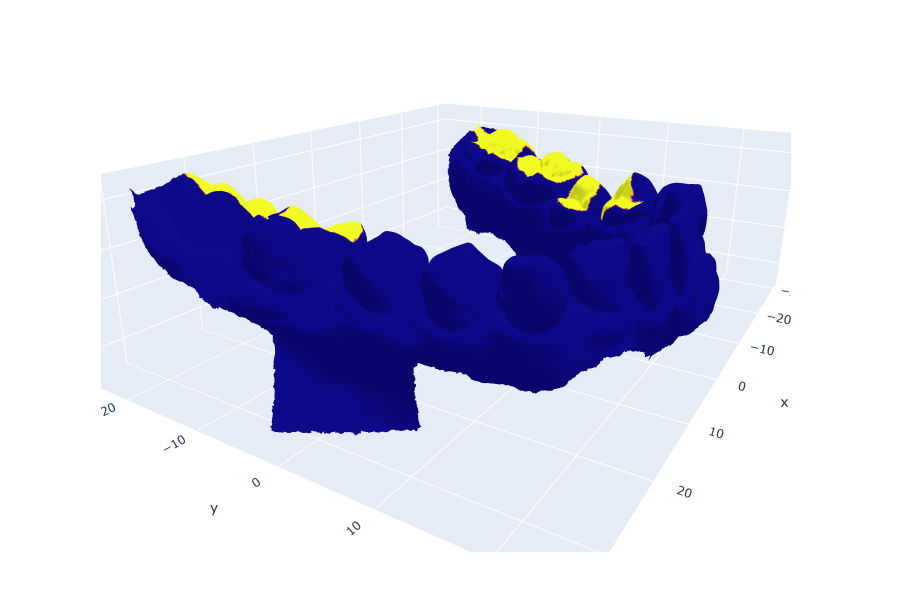
The problem is that the points that are plotted in the 2D plot are part of a 3D Mesh (a model of a human jaw) and the 3D plot plots a 3D Graph (Instead of a mesh like the one in the image below). I used the example from the bokeh documentation Wrapping a javascript library example.
I want to wrap something similar to a plotly mesh, like this one:
Do you know any code which can be wrapped like the Surface3D from the example? or a way of embedding the plotly mesh3D into a plot?, any suggestion is more than welcomed
You might also have a look at Panel, which can create dashboards combining various different plotting tools, including Bokeh: https://panel.holoviz.org/
Panel uses the Bokeh server internally, and they wrap it with their own launcher, e.g.
panel serve app.py
and then the panel app could contain Bokeh or MPL or plotly or altair. But Panel is a separate project maintained by a different team of people. Questions about it are best directed at the HoloViz Discourse: