Hi,
I have an application which uses a plot for graphical selection of a point of interest and an associated plot that constrains a result to be on a curve (or surface in higher dimensions). In the simplest case of a univariate function, the selector is 1D and works like a slider.
The interactions between the selector and the constrained-point viewer all behave as expected.
However, if I have multiple pairs of selectors/viewer, and try to link their selected operating/evaluation point, unexpected results occur. Specifically, I link them via js_link callbacks on their data sources. It appears the linkage works for the first interaction, but subsequent interactions fail to update the selectors to be at the same point.
I can see that the callback is being invoked for each source, but the data patch doesn’t seem to update the slider-like selector plot.
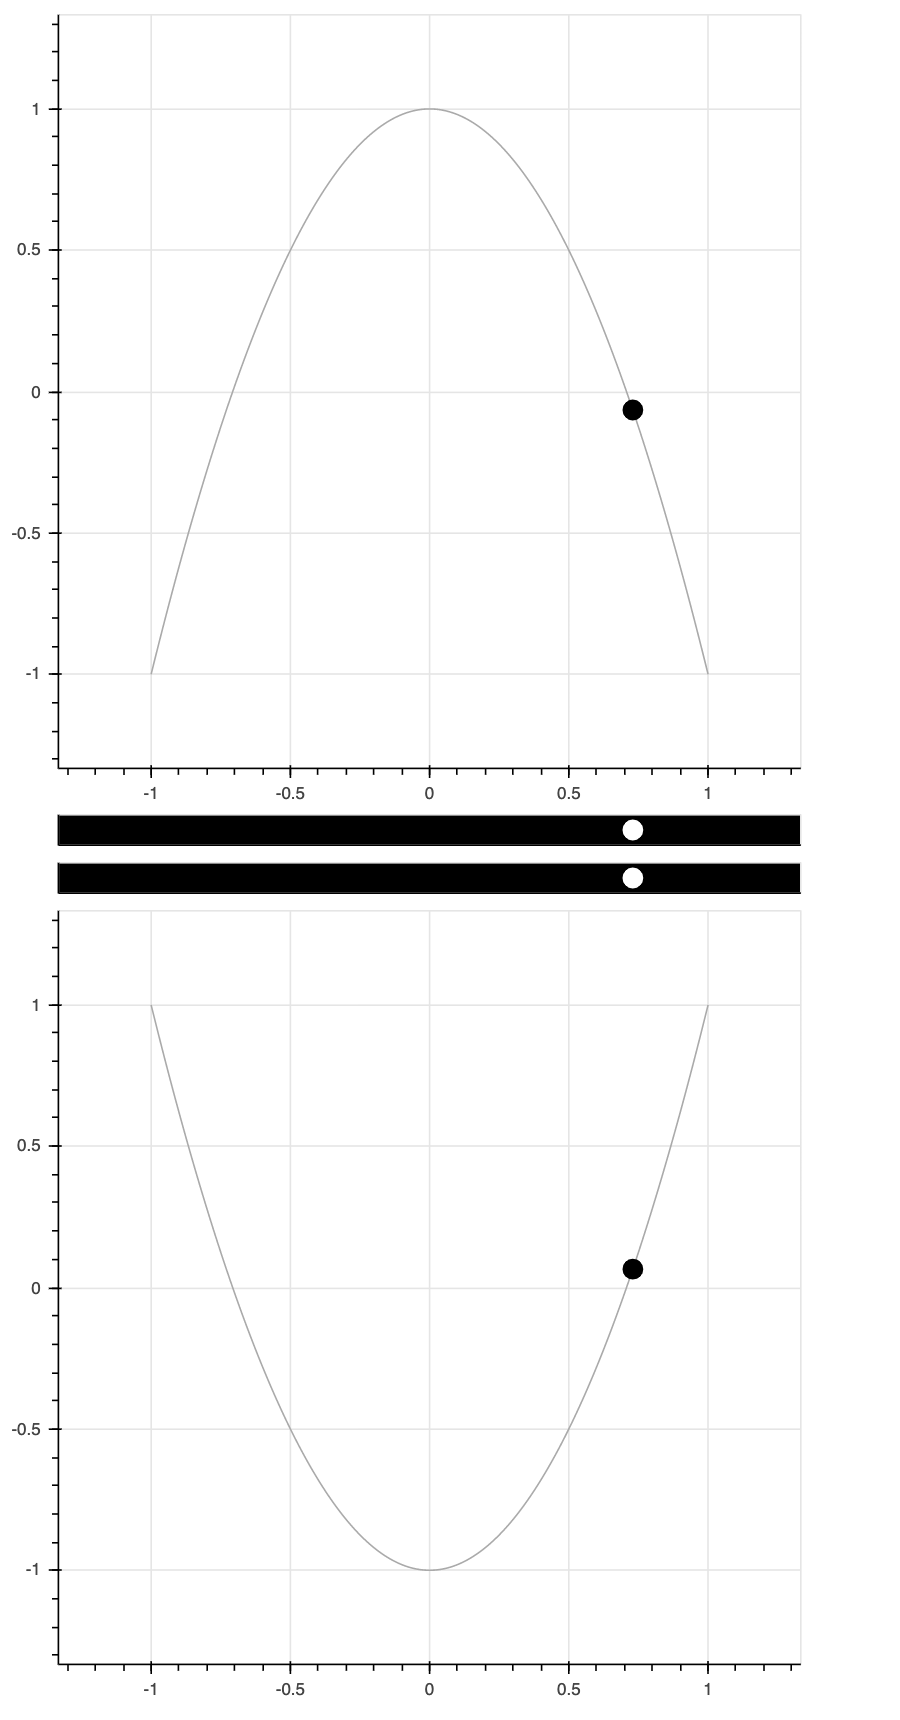
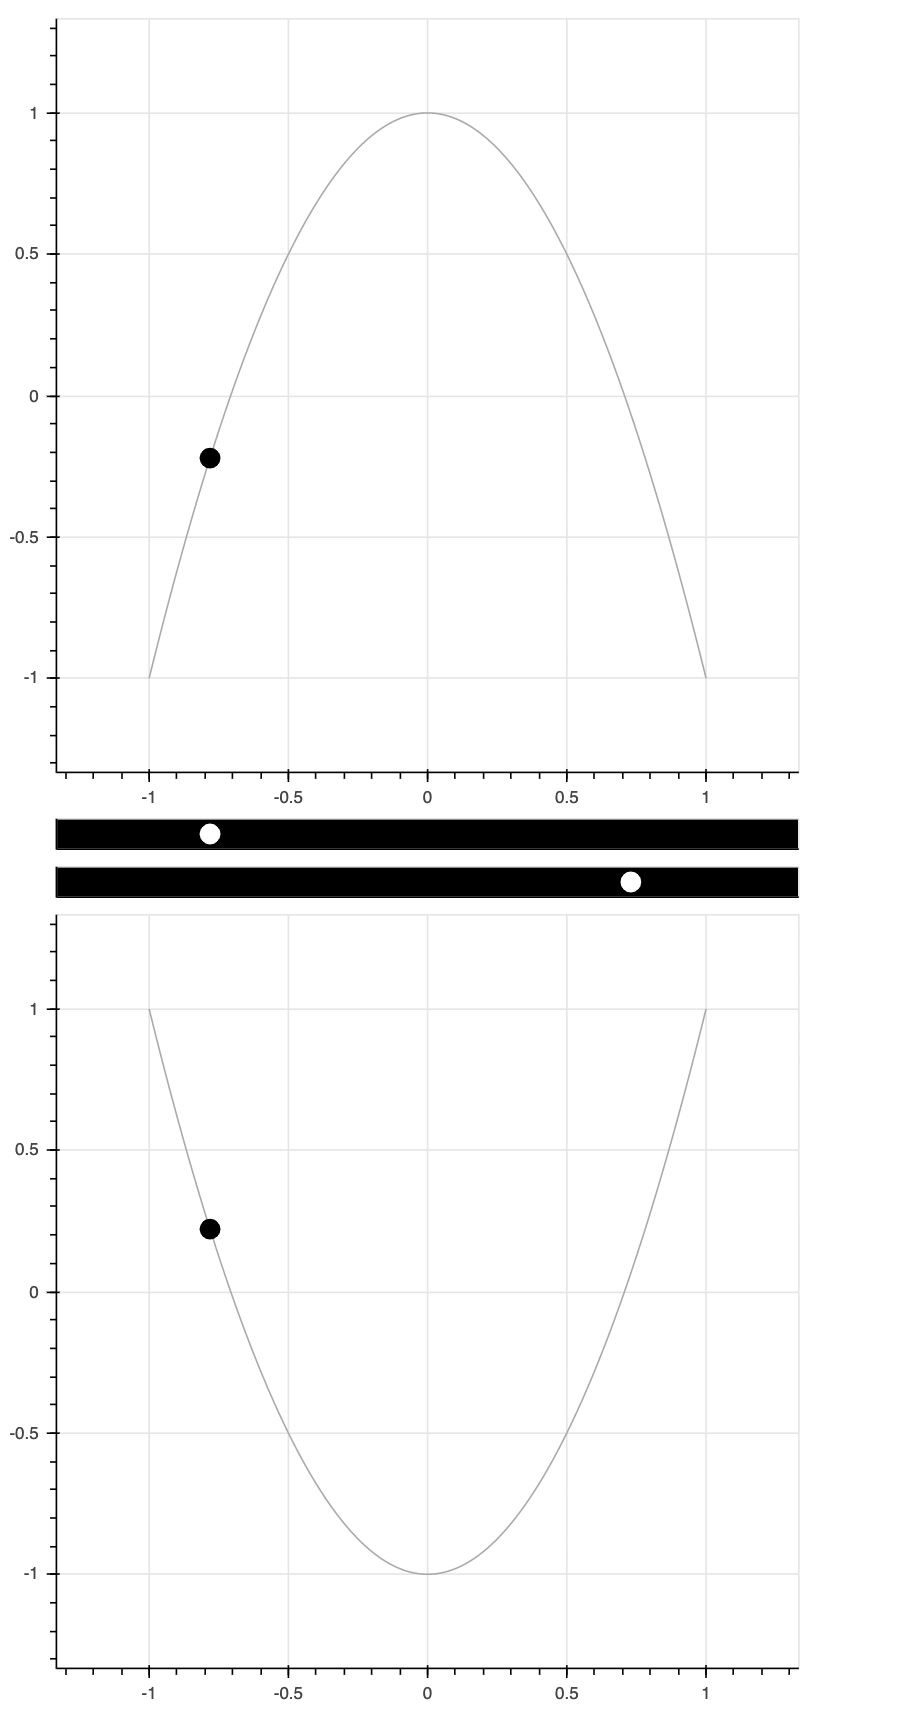
A simplified example illustrating the problem follows. I am running as a bokeh server. The bokeh version is 2.0.1. Two screen shots of the simplified problem are attached. The first shows the plots in a consistent state (after the first user-interaction to select a desired operating/evaluation point). The second shows the plots in an inconsistent state (after a subsequent user interaction to select a different desired operating/evaluation point). Note: that the lower-plot selector has not moved to be at the same point as the upper-plot selector, but its associated constrained curve output has.
#!/usr/bin/env python3
# -*- coding: utf-8 -*-
"""
"""
import sys
import numpy as np

from bokeh.plotting import figure, curdoc
from bokeh.transform import transform

from bokeh.layouts import column

from bokeh.models import LinearInterpolator
from bokeh.models import ColumnDataSource, PointDrawTool


# Lower/upper quadratic-function constrained-point viewers
p0L = figure(x_range=(-1.333,1.333), y_range=(-1.333,1.333), width=500, height=500)
p0L.toolbar_location = None

p0U = figure(x_range=(-1.333,1.333), y_range=(-1.333,1.333), width=500, height=500)
p0U.toolbar_location = None


# Lower/upper linked x- selector figures
p1L= figure(x_range=p0L.x_range, y_range=p0L.y_range, width=500, height=30, background_fill_color='#000000')

p1L.xaxis.major_label_text_color = None
p1L.xaxis.major_label_text_font_size = '0pt'

p1L.xaxis.ticker.desired_num_ticks = 0
p1L.yaxis.ticker.desired_num_ticks = 0

p1L.toolbar_location = None


p1U= figure(x_range=p0U.x_range, y_range=p0U.y_range, width=500, height=30, background_fill_color='#000000')

p1U.xaxis.major_label_text_color = None
p1U.xaxis.major_label_text_font_size = '0pt'

p1U.xaxis.ticker.desired_num_ticks = 0
p1U.yaxis.ticker.desired_num_ticks = 0

p1U.toolbar_location = None


# Quadratic reference curves
xq = np.arange(-1.000,1.001,0.001)
yq = 2.000*(xq ** 2) - 1.000
SqL = ColumnDataSource(data=dict(xq=xq, yq=yq))
p0L.line(x='xq', y='yq', source=SqL, line_color='#AAAAAA')

SqU = ColumnDataSource(data=dict(xq=xq, yq=-yq))
p0U.line(x='xq', y='yq', source=SqU, line_color='#AAAAAA')


# Point on curve
# Linear interpolators constrain interactive taps to reference curve
li_xL = LinearInterpolator(x='xq', y='xq', data=SqL, clip=False)
li_yL = LinearInterpolator(x='xq', y='yq', data=SqL, clip=False)

li_xU = LinearInterpolator(x='xq', y='xq', data=SqU, clip=False)
li_yU = LinearInterpolator(x='xq', y='yq', data=SqU, clip=False)

Spt0L = ColumnDataSource(data=dict(xpt=[xq[500]]))
Spt1L = ColumnDataSource(data=dict(xpt=[xq[500]]))

Spt0U = ColumnDataSource(data=dict(xpt=[xq[500]]))
Spt1U = ColumnDataSource(data=dict(xpt=[xq[500]]))

def lim_cb(attr, old, new, src):
    print("source [{:}] op OLD:{:+.3f} NEW:{:+.3f}".format(src, old['xpt'][0],new['xpt'][0]))
    print("")
    sys.stdout.flush()

    op = min(max(new['xpt'][0], -1.0), 1.0)
    data_patch = {}
    data_patch.update(xpt=[(0, op)])
    src.patch(data_patch)

f0L = lambda attr, old, new, src=Spt0L: lim_cb(attr, old, new, src)
f0U = lambda attr, old, new, src=Spt0U: lim_cb(attr, old, new, src)
Spt1L.on_change('data', f0L)
Spt1U.on_change('data', f0U)

r0L = p0L.circle(x=transform('xpt', li_xL), y=transform('xpt', li_yL), source=Spt0L, size=12, fill_color='#000000', line_color='#000000')
r1L = p1L.circle(x=transform('xpt', li_xL), y=0.0, source=Spt1L, size=12, fill_color='#FFFFFF', line_color='#FFFFFF')

_drawtool = PointDrawTool(renderers=[r1L], add=True, num_objects=1)
p1L.add_tools(_drawtool)
p1L.toolbar.active_tap = _drawtool

r0U = p0U.circle(x=transform('xpt', li_xU), y=transform('xpt', li_yU), source=Spt0U, size=12, fill_color='#000000', line_color='#000000')
r1U = p1U.circle(x=transform('xpt', li_xU), y=0.0, source=Spt1U, size=12, fill_color='#FFFFFF', line_color='#FFFFFF')

_drawtool = PointDrawTool(renderers=[r1U], add=True, num_objects=1)
p1U.add_tools(_drawtool)
p1U.toolbar.active_tap = _drawtool

# Link lower/upper selectors
link_sel = True
if link_sel:
    Spt1U.js_link('data', Spt1L, 'data')
    Spt1L.js_link('data', Spt1U, 'data')

curdoc().add_root(column(p0U,p1U,p1L,p0L))