I am trying to plots that have the same physical height and width of the plotted area (axes). The problem is that it seems the plot hight and width include axis labels. So, when the values on the y axis differ, say 0 to 100 on one plot and 0 to 10000 on the other, the added width of the label for 10000 causes the plot area to shrink a little horizontally so that it all still fits in.
so does anyone know of a way to have a plot area width and height that is fixed, and the size of the labels (or even a legend) would cause the figure height and width to change, rather than the other way around?
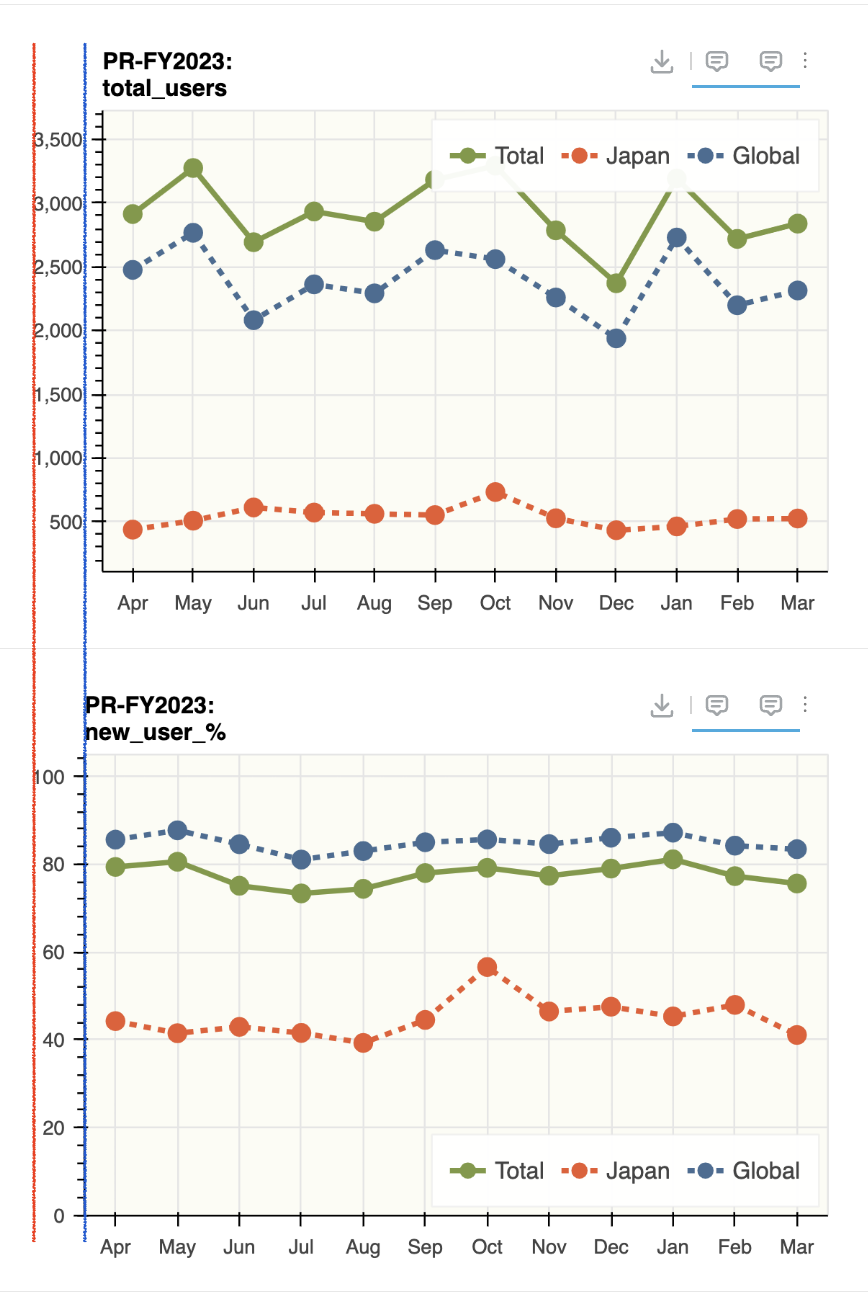
this figure is what i mean
i added vertical red and blue lines to show that even though these plots have the same settings, the axis width of the upper one is shorter because the y labels are longer. the slight offset makes me physically ill.
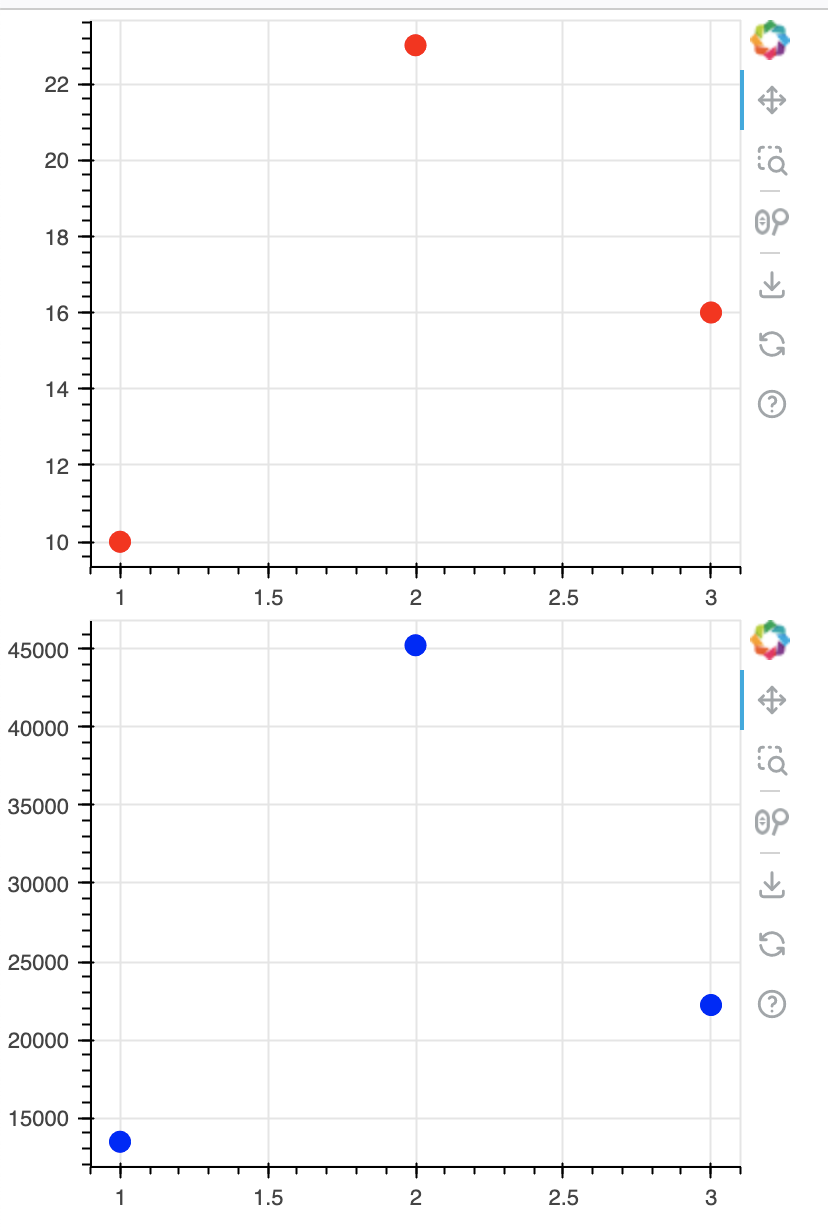
@adam1 Not sure why, you have not provided the code that produce what you observe. When I run the code below where I use column for layout of the two plots, I do not observe misalignment of the y-axis.