Plotting categorical data two variables

I’ve just started using this library and I am really confused. I simply need to visualise this kind of table:

month name number
Jan Peter 10
Jan Kelly 15
Feb Peter 12
Feb Kelly 23
Mar Peter 4
Mar Kelly 12

and so on

x-axis: two columns (Peter/Kelly) per month, y-axis: number

It’s one line of code if I use seaborn. How do I do that using bokeh? The examples provided in the documentation use a different dataframe structure altogether. Do I need to break down my table into multiple variables? Some examples would be really appreciated.

It sounds like you are trying to make a categorical heatmap? The example there is a little complicated because it has to synthesize the months and years individually. Your data looks like it could drive a categorical heatmap as-is. I’d suggest you study that example and then try to create your own version. It will be much easier for people here to help you if you come with a Minimal Reproducible Example (including any data) in hand.

hey thanks for your reply! I don’t need a heatmap, here’s an example of what I need:

columsexample

There are two ways to have grouped bars: nested categories or a visual dodge. Both are described and illustrated with complete examples in the docs:

https://docs.bokeh.org/en/latest/docs/user_guide/categorical.html#grouping

Based on you example image, it seems like you probably want to use a visual dodge.

Note also that if you want one liners you might want to look at higher level tools built on top of Bokeh, e.g. Holoviews or Pandas-Bokeh. Here are similar types of plots in Holoviews:

Bars — HoloViews v1.15.0

Like I stated in the beginning, I’ve seen those examples and failed to reproduce them with my data. Here’s what I need to write using seaborn to visualize the same data table:

sns.catplot(x=“month”, y=“number_of_messages”, hue=“name”, kind=“bar”, data=freq_month, palette=“Blues_r”)

That’s it, literally one line of code… According to your example from the documentation I need 3 variables and like 20 lines to code to archive the same result. So I thought it can’t be that difficult and I must have overlooked something.

If you use a low-level library like Bokeh or Matplotlib then it will take you ~20 lines of code. If you use a high-level library (e.g. HoloViews or Seaborn) that is designed to manipulate and display pandas-like data in the way you want then it will take you 1 line of code. You cannot use a low-level library (Bokeh) and insist on the ease of a high-level library (Seaborn).

Bryan gave you the correct link to the HoloViews example that you need, so follow that.

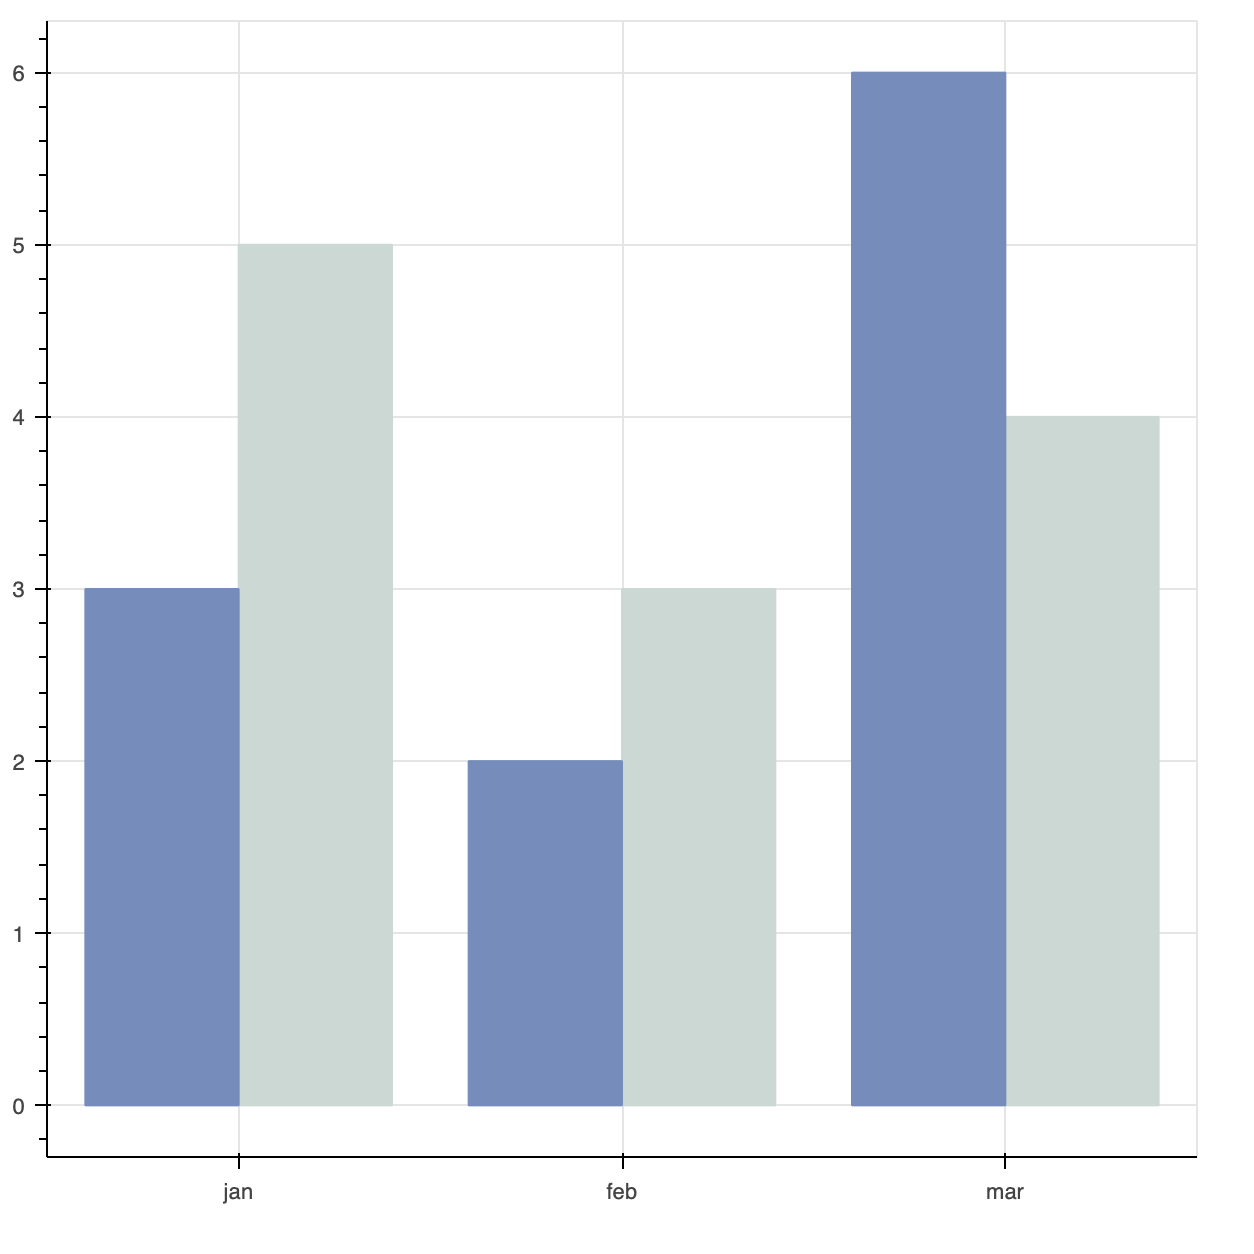
@Wait_What It doesn’t take 20 lines, lots of the lines in that example have to do with formatting and appearance. But it also does not take one line. Bokeh’s priority is being general purpose and flexible. This makes it somewhat more verbose, but also a great target for higher level, specialized and opinionated tools to build on. [1]

from bokeh.models import ColumnDataSource
from bokeh.plotting import figure, show
from bokeh.transform import dodge
import pandas as pd

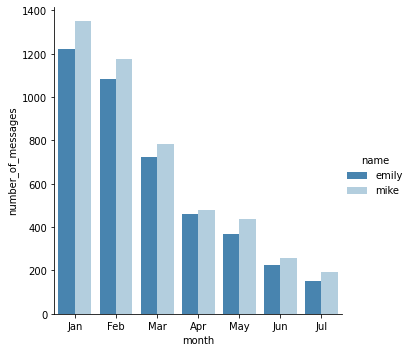
months = ['jan', 'feb', 'mar']

data = pd.DataFrame({
    'month'  : ['jan', 'jan', 'feb', 'feb', 'mar', 'mar'],
    'name'   : ['peter', 'kelly', 'peter', 'kelly', 'peter', 'kelly'],
    'number' : [5, 3, 3, 2, 4, 6],
})

# three lines:

p = figure(x_range=months, toolbar_location=None, tools="")

p.vbar(x=dodge('month', 0.2, range=p.x_range), top='number', width=0.4,
       source=data[data.name=='peter'], color="#c9d9d3")

p.vbar(x=dodge('month',  -0.2,  range=p.x_range), top='number', width=0.4,
       source=data[data.name=='kelly'], color="#718dbf")

show(p)

This is not the only way to do this, and maybe not the best, since it duplicates data on the client. But it’s probably the shortest which seems to be your primary concern.


  1. I don’t personally consider Bokeh to be low level. To me “low level” would be drawing on the HTML canvas manually yourself. But it’s also not high level, either. ↩︎

Lastly, a bit of advice regarding asking for help with OSS projects:

I’ve seen those examples and failed to reproduce them with my data.

Where was the code for those failed attempts? If you had shared the actual code you tried, i.e. provided a Minimal Reproducible Example, chances are it could have been copy and pasted, and tweaked, and fixed in a few moments. Oftentimes it’s possible for someone to see where you have gone astray even just by inspection. Asking for help without sharing your own code attempts means waiting until someone who is already volunteering their time for free has the bandwidth or inclination to invent a solution out of nothing, which which may very well be never.

This topic was automatically closed 90 days after the last reply. New replies are no longer allowed.