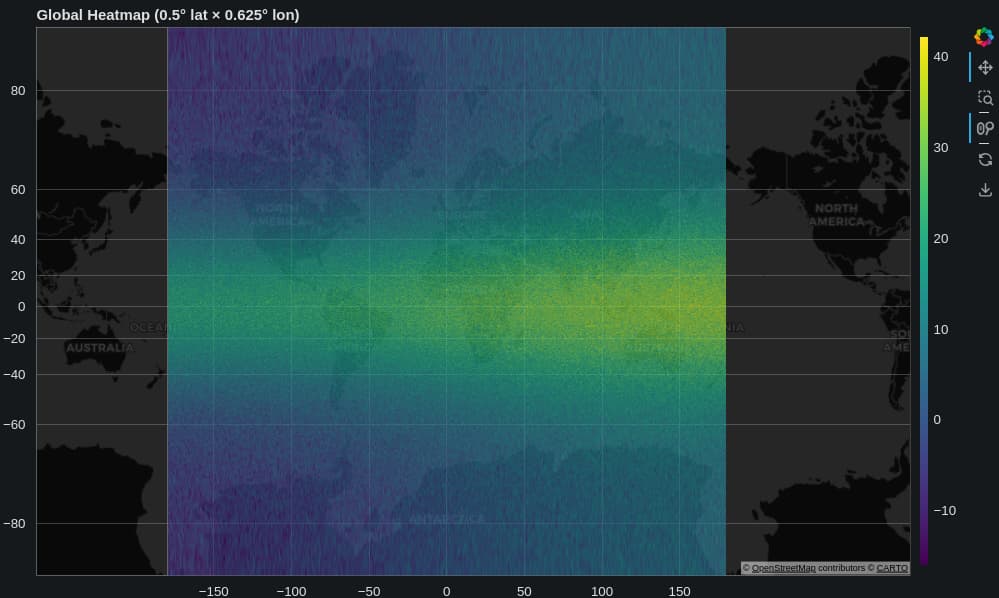
When overlaying a gridded heatmap (like global temperature) onto a map, simply plotting the values at their (lat, lon) centers can lead to misalignment—especially with Web Mercator maps, which are the standard for most interactive web mapping.
To ensure each heatmap cell is accurately projected and aligns with real-world locations, I first convert the latitude and longitude centers of my data to Web Mercator coordinates. Then, I use scipy.interpolate.RegularGridInterpolator to resample the original grid onto a regular Mercator grid, so that each pixel matches the map’s projection.
This step is essential for climate, weather, or any geospatial raster data: without it, your heatmap will be visibly shifted, stretched, or skewed—especially at high latitudes.
import numpy as np
import pandas as pd
from bokeh.plotting import figure, show
from bokeh.models import LinearColorMapper, ColorBar, Range1d
from bokeh.palettes import Viridis256
from bokeh.io import curdoc
import xyzservices.providers as xyz
from scipy.interpolate import RegularGridInterpolator

# Example: Create sample global gridded data with centered coordinates
# Global grid with 0.5° latitude and 0.625° longitude resolution
lat_centers = np.arange(-89.75, 90, 0.5)      # -89.75 to 89.75 with 0.5° spacing (360 points)
lon_centers = np.arange(-179.6875, 180, 0.625) # -179.6875 to 179.6875 with 0.625° spacing (576 points)
lat_pixel_size = lat_centers[1]-lat_centers[0]
lon_pixel_size = lon_centers[1]-lon_centers[0]
# Create a sample global 2D data array (replace with your actual data)
# Example: create some interesting global pattern (temperature-like)
LON_2D, LAT_2D = np.meshgrid(lon_centers, lat_centers)
data_2d = (
    20 * np.cos(np.radians(LAT_2D * 2)) +  # Temperature gradient by latitude
    10 * np.sin(np.radians(LON_2D / 2)) +  # Longitudinal variation
    5 * np.random.randn(*LAT_2D.shape) +   # Some noise
    15  # Base temperature
)

# Web Mercator projection transformer
def lat_lon_to_web_mercator(lon, lat):
    """
    Convert latitude/longitude to Web Mercator coordinates
    """
    # Earth's radius in meters
    R = 6378137.0

    # Convert to radians
    lat_rad = np.radians(lat)
    lon_rad = np.radians(lon)

    # Web Mercator formulas
    x = R * lon_rad
    y = R * np.log(np.tan(np.pi/4 + lat_rad/2))

    return x, y

def web_mercator_to_lat_lon(x, y):
    """
    Convert Web Mercator coordinates back to latitude/longitude
    """
    # Earth's radius in meters
    R = 6378137.0

    # Web Mercator inverse formulas
    lon = np.degrees(x / R)
    lat = np.degrees(2 * np.arctan(np.exp(y / R)) - np.pi/2)

    return lon, lat

def create_heatmap_from_centers(lat_centers, lon_centers, data_2d,
                               lat_pixel_size, lon_pixel_size):
    """
    Convert centered grid coordinates to corner coordinates for Bokeh heatmap
    """
    # Calculate corner coordinates from center coordinates
    lat_edges = lat_centers - lat_pixel_size / 2
    lon_edges = lon_centers - lon_pixel_size / 2

    # Create coordinate arrays for each pixel
    lats = []
    lons = []
    values = []

    for i, lat_center in enumerate(lat_centers):
        for j, lon_center in enumerate(lon_centers):
            # Calculate the four corners of each pixel
            lat_bottom = lat_center - lat_pixel_size / 2
            lat_top = lat_center + lat_pixel_size / 2
            lon_left = lon_center - lon_pixel_size / 2
            lon_right = lon_center + lon_pixel_size / 2

            # For rect glyph, we need center coordinates and dimensions
            lats.append(lat_center)
            lons.append(lon_center)
            values.append(data_2d[i, j])

    return lats, lons, values, lat_pixel_size, lon_pixel_size

# Method 1: Using rect glyph (recommended for regular grids)
def plot_heatmap_with_rect(lat_centers, lon_centers, data_2d,
                          lat_pixel_size, lon_pixel_size):
    """
    Plot heatmap using rect glyph - keeps original center coordinates
    """
    lats, lons, values, lat_size, lon_size = create_heatmap_from_centers(
        lat_centers, lon_centers, data_2d, lat_pixel_size, lon_pixel_size
    )

    # Create DataFrame
    df = pd.DataFrame({
        'lat': lats,
        'lon': lons,
        'value': values
    })

    # Create color mapper
    color_mapper = LinearColorMapper(palette=Viridis256,
                                   low=min(values),
                                   high=max(values))

    # Create figure
    p = figure(title="Heatmap from Centered Grid Points (Rect Method)",
               x_axis_label="Longitude",
               y_axis_label="Latitude",
               width=600, height=500,
               tools="pan,wheel_zoom,box_zoom,reset,save")

    # Add rectangles
    p.rect(x='lon', y='lat',
           width=lon_size, height=lat_size,
           source=df,
           fill_color={'field': 'value', 'transform': color_mapper},
           line_color='white', line_width=0.5)

    # Add colorbar
    color_bar = ColorBar(color_mapper=color_mapper, width=8, location=(0,0))
    p.add_layout(color_bar, 'right')

    return p

# Method 2: Using image glyph with map tiles and proper Web Mercator interpolation (PREFERRED)
def plot_heatmap_with_image_and_tiles(lat_centers, lon_centers, data_2d,
                                     lat_pixel_size, lon_pixel_size,
                                     lat_range=None, lon_range=None):
    """
    Plot heatmap using image glyph with map tiles background and proper Web Mercator interpolation

    Parameters:
    -----------
    lat_range, lon_range : tuple, optional
        (min, max) ranges to plot. If None, uses full global extent.
    """
    # If ranges are specified, subset the data
    if lat_range is not None or lon_range is not None:
        if lat_range is None:
            lat_range = (lat_centers.min(), lat_centers.max())
        if lon_range is None:
            lon_range = (lon_centers.min(), lon_centers.max())

        # Find indices for the specified ranges
        lat_mask = (lat_centers >= lat_range[0]) & (lat_centers <= lat_range[1])
        lon_mask = (lon_centers >= lon_range[0]) & (lon_centers <= lon_range[1])

        lat_subset = lat_centers[lat_mask]
        lon_subset = lon_centers[lon_mask]
        data_subset = data_2d[np.ix_(lat_mask, lon_mask)]
    else:
        # Use full global data
        lat_subset = lat_centers
        lon_subset = lon_centers
        data_subset = data_2d

    # Calculate the bounds of the grid
    lat_min = lat_subset[0] - lat_pixel_size / 2
    lat_max = lat_subset[-1] + lat_pixel_size / 2
    lon_min = lon_subset[0] - lon_pixel_size / 2
    lon_max = lon_subset[-1] + lon_pixel_size / 2

    # Clamp latitude to Web Mercator limits (-85.0511 to 85.0511)
    lat_min = max(lat_min, -85.0511)
    lat_max = min(lat_max, 85.0511)

    # Transform coordinates to Web Mercator
    x_min, y_min = lat_lon_to_web_mercator(lon_min, lat_min)
    x_max, y_max = lat_lon_to_web_mercator(lon_max, lat_max)

    # Create interpolator for the subset grid data
    interpolator = RegularGridInterpolator(
        (lat_subset, lon_subset),
        data_subset,
        method='linear',
        bounds_error=False,
        fill_value=np.nan
    )

    # Define target resolution in Web Mercator space
    # Adjust resolution based on the area being plotted
    lat_span = lat_max - lat_min
    lon_span = lon_max - lon_min

    if lat_span > 60:  # Global or large region
        target_width = 1024
        target_height = 512
    elif lat_span > 20:  # Continental scale
        target_width = 800
        target_height = 600
    else:  # Regional scale
        target_width = 600
        target_height = 400

    # Create uniform grid in Web Mercator space
    x_mercator = np.linspace(x_min, x_max, target_width)
    y_mercator = np.linspace(y_min, y_max, target_height)
    X_mercator, Y_mercator = np.meshgrid(x_mercator, y_mercator)

    # Convert Web Mercator grid back to lat/lon for interpolation
    LON_interp, LAT_interp = web_mercator_to_lat_lon(X_mercator, Y_mercator)

    # Create points for interpolation
    points = np.column_stack([LAT_interp.ravel(), LON_interp.ravel()])

    # Interpolate data to the new grid
    interpolated_data = interpolator(points)
    interpolated_grid = interpolated_data.reshape(target_height, target_width)

    # Handle NaN values (areas outside original grid)
    interpolated_grid = np.ma.masked_invalid(interpolated_grid)

    # Create figure with Web Mercator coordinates
    p = figure(title=f"Global Heatmap ({lat_pixel_size}° lat × {lon_pixel_size}° lon)",
               x_axis_type="mercator", y_axis_type="mercator",
               width=1000, height=600,
               x_range=Range1d(x_min, x_max),
               y_range=Range1d(y_min, y_max),
               tools="pan,wheel_zoom,box_zoom,reset,save")

    # Add map tiles (CartoDB Dark Matter)
    p.add_tile(xyz.CartoDB.DarkMatter)

    # Flip data vertically for image display (image origin is top-left)
    data_flipped = np.flipud(interpolated_grid)

    # Create color mapper
    valid_data = interpolated_grid[~np.isnan(interpolated_grid)]
    if len(valid_data) > 0:
        color_mapper = LinearColorMapper(palette=Viridis256,
                                       low=np.percentile(valid_data, 2),
                                       high=np.percentile(valid_data, 98))
    else:
        color_mapper = LinearColorMapper(palette=Viridis256, low=0, high=1)

    # Add semi-transparent image overlay
    p.image(image=[data_flipped],
            x=x_min, y=y_min,
            dw=x_max-x_min,
            dh=y_max-y_min,
            palette=Viridis256,
            alpha=0.7)  # Make heatmap semi-transparent to see map underneath

    # Add colorbar
    color_bar = ColorBar(color_mapper=color_mapper, width=8, location=(0,0))
    p.add_layout(color_bar, 'right')

    print(f"Original grid: {data_subset.shape}")
    print(f"Interpolated grid: {interpolated_grid.shape}")
    print(f"Latitude range: {lat_min:.3f} to {lat_max:.3f}")
    print(f"Longitude range: {lon_min:.3f} to {lon_max:.3f}")
    print(f"Web Mercator X range: {x_min:.0f} to {x_max:.0f}")
    print(f"Web Mercator Y range: {y_min:.0f} to {y_max:.0f}")

    return p

# Example usage with global grid
if __name__ == "__main__":
    # Global grid with your specified resolution
    print("Creating global heatmap with 0.5° lat × 0.625° lon resolution...")

    # Plot full global heatmap
    p_global = plot_heatmap_with_image_and_tiles(lat_centers, lon_centers, data_2d,
                                                lat_pixel_size, lon_pixel_size)

    # Show global plot
    show(p_global)

    # Example: Plot a regional subset (Europe)
    print("\nCreating regional heatmap for Europe...")
    p_europe = plot_heatmap_with_image_and_tiles(lat_centers, lon_centers, data_2d,
                                                lat_pixel_size, lon_pixel_size,
                                                lat_range=(35, 70), lon_range=(-10, 40))

    # Show European plot
    # show(p_europe)  # Uncomment to show

    print("Global heatmap plotted successfully!")
    print(f"Global grid info:")
    print(f"  Latitude points: {len(lat_centers)} (from {lat_centers[0]}° to {lat_centers[-1]}°)")
    print(f"  Longitude points: {len(lon_centers)} (from {lon_centers[0]}° to {lon_centers[-1]}°)")
    print(f"  Pixel size: {lat_pixel_size}° lat × {lon_pixel_size}° lon")
    print(f"  Total grid cells: {len(lat_centers) * len(lon_centers):,}")

    # Verification: Print corner coordinates for a sample point
    sample_lat = 45.25  # Example center
    sample_lon = 12.1875  # Example center
    lat_corners = [sample_lat - lat_pixel_size/2, sample_lat + lat_pixel_size/2]
    lon_corners = [sample_lon - lon_pixel_size/2, sample_lon + lon_pixel_size/2]
    print(f"\nSample pixel at ({sample_lat}°, {sample_lon}°):")
    print(f"  Latitude corners: {lat_corners}")
    print(f"  Longitude corners: {lon_corners}")

    print(f"\nNote: Web Mercator projection handles latitude distortion automatically")
    print(f"      Pixels appear larger at higher latitudes as expected")