I’d like to be able to reproduce this plot from matplotlib:
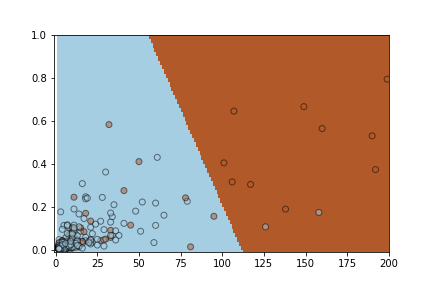
The background is the decision boundary for an SVM trained on the data. I can use figure.image to render the np.meshgrid object in Bokeh:
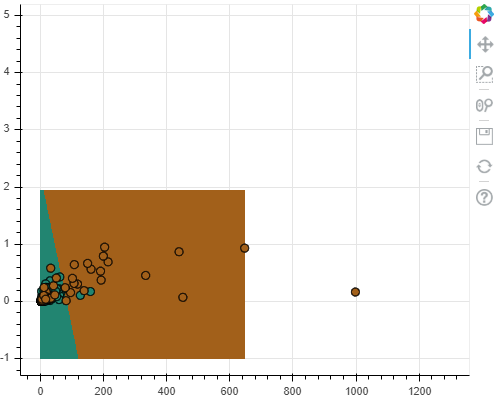
It would obviously interact faster and fill the entire page if I could use an annotation instead. The closest thing I found was a BoxAnnotation, but as far as I could see there is no way to angle the boundaries. Any thoughts on how to plot an angled decision boundary like this?