Plotting hexbin over google map

Hi!
I want to plot this with a google maps background, any suggestion?

x = CDMXhex['longitud']
y = CDMXhex['latitud']
bins = hexbin(x, y, 0.01)

p = figure(title="Violacion", match_aspect=True,
          background_fill_color='#440154')
p.grid.visible = False

p.hex_tile(q="q", r="r", size=0.01, line_color=None, source=bins,
           fill_color=linear_cmap('counts', 'Viridis256', 
           0, max(bins.counts)))

show(p)

So I think this is possible, but might take some doing. The relevant thing to know is that the coordinates of a Google Map are “Web Mercator” so you will need to first convert any lat/lon values to Web Mercator northings and eastings. Bokeh only does Web Mercator transforms in BokehJS, so you will have to Google for a suitable bit of code to do that yourself in Python. Then, you will need to convert those into axial (hex) r and q coordinates. Bokeh does provide some Python routines that can help with that, e.g. bokeh.util.hex.cartesian_to_axial

Here is a link that might help with the conversion to Web Mercator:

i´m lost, so after
bokeh.util.hex.cartesian_to_axial(x,y,size=0.01, orientation=‘pointytop’)

i have my array and then?

I have led you a bit astray. I picked up on the hex_tile call and missed hexbin. I think it is simpler:

  • Convert your lat/lon values to web mercator and pass these to hexbin
  • The size is in meters (since web mercator units are meters) you will want something much larger than 0.01

From there everything is the same as the original code you posted.

Well, except gmap does not have hex_tile and hexbin methods like figure does. :frowning: If you can use OSM tiles instead of Google Maps, you could use add_tile on a figure. Otherwise, it will take some work to basically reproduce the built-in hex methods on figure to also be on gmap. I can take a look at the but probably not until tomorrow night.

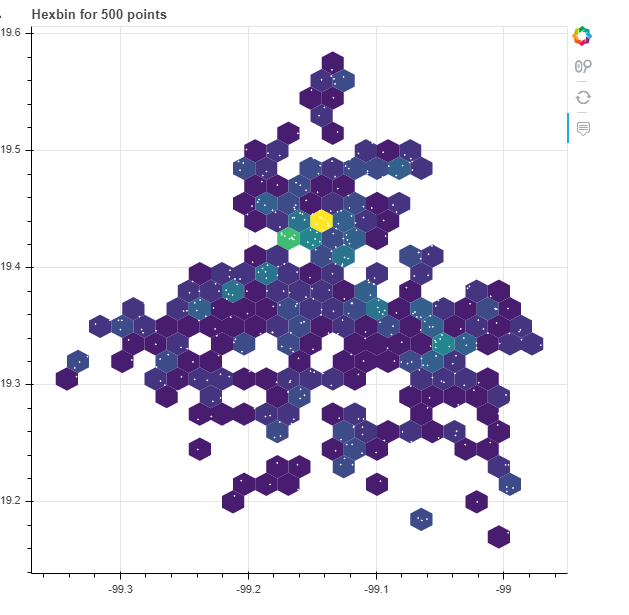
So, this is my code for this and everything’s fine!

p = figure(title=“Hexbin for 500 points”, match_aspect=False,
tools=“wheel_zoom,reset”)

r, bins = p.hexbin(x, y, size=0.01, hover_color=“pink”, hover_alpha=0)

p.circle(x, y, color=“white”, size=1)

p.add_tools(HoverTool(
tooltips=[(“count”, “@c”), ("(q,r)", “(@q, @r)”)],
mode=“mouse”, point_policy=“follow_mouse”, renderers=[r]
))

show(p)

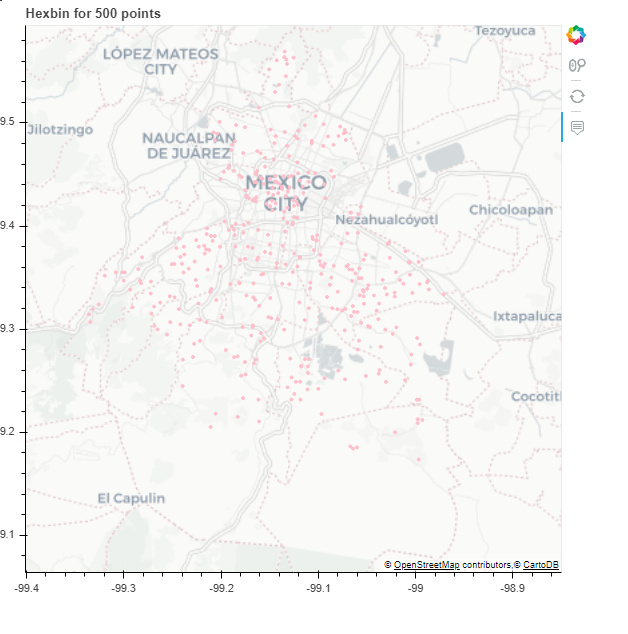
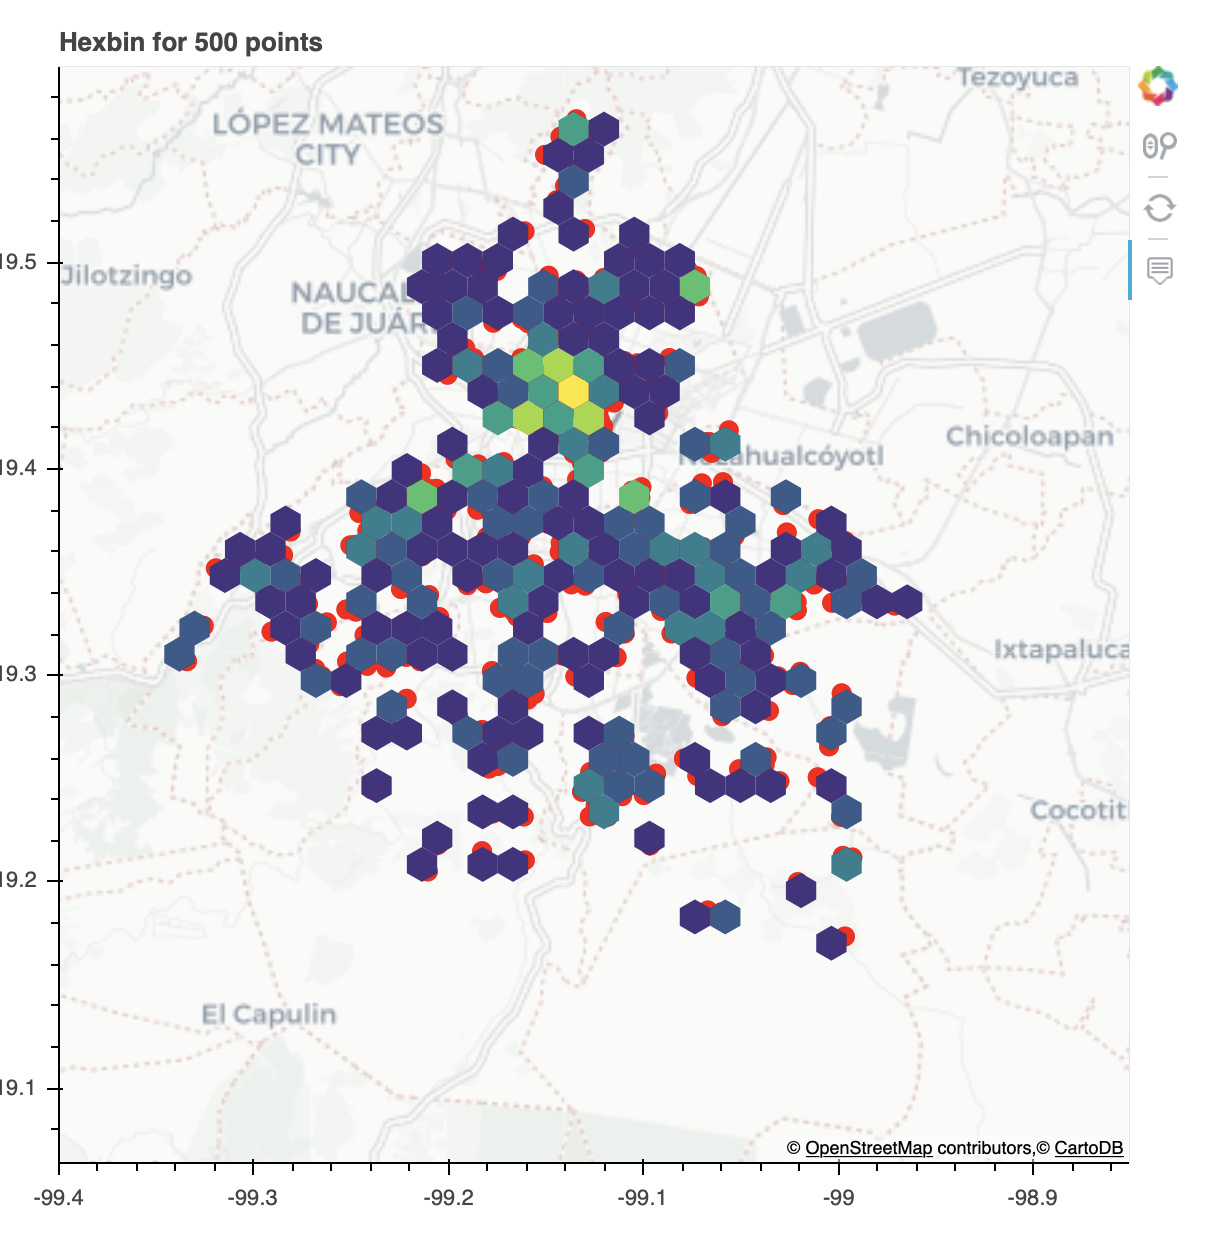
But when i add add_tiles i’m getting this


tile_provider = get_provider(Vendors.CARTODBPOSITRON)

p = figure(title=“Hexbin for 500 points”, match_aspect=False,
tools=“wheel_zoom,reset”, x_range=(-11059823.40, -11009374.97), y_range=(2162444.18, 2225046.15),
x_axis_type=“mercator”, y_axis_type=“mercator”)

r, bins = p.hexbin(x, y, size=0.01, hover_color=“pink”, hover_alpha=0)

p.circle(x, y, color=“white”, size=1)

p.add_tools(HoverTool(
tooltips=[(“count”, “@c”), ("(q,r)", “(@q, @r)”)],
mode=“mouse”, point_policy=“follow_mouse”, renderers=[r]
))

p.add_tile(tile_provider)

show(p)

Can you try explicitly setting he tile layer as an underlay?

r = p.add_tile(tile_provider)
r.level = "underlay"

So close!
With this code i can see my circles, but i can´t find my hexbins!!

def wgs84_to_web_mercator(df, lon="longitud", lat="latitud"):
    """Converts decimal longitude/latitude to Web Mercator format"""
    k = 6378137
    df["x"] = df[lon] * (k * np.pi/180.0)
    df["y"] = np.log(np.tan((90 + df[lat]) * np.pi/360.0)) * k
    return df


CDMXhex= wgs84_to_web_mercator(CDMXhex)
x = CDMXhex['x']
y = CDMXhex['y']
tile_provider = get_provider(Vendors.CARTODBPOSITRON)

p = figure(title="Hexbin for 500 points", match_aspect=False, tools="wheel_zoom,reset", x_range=(-11059823.40, -11009374.97), y_range=(2162444.18, 2225046.15), x_axis_type="mercator", y_axis_type="mercator")

p.circle(CDMXhex.x, CDMXhex.y, color="pink", size=3)

p.grid.visible = True

r, bins = p.hexbin(CDMXhex.x,CDMXhex.y, size=0.5, hover_color="pink", hover_alpha=0.8)


p.add_tools(HoverTool(
    tooltips=[("count", "@c"), ("(q,r)", "(@q, @r)")],
    show_arrow=True,mode="mouse", point_policy="follow_mouse", renderers=[r]
))
r = p.add_tile(tile_provider)
r.level = "underlay"

show(p)

Is there any way you can provide a small sample or synthetic data set so I can run your code locally to investigate?

@unmexicano you were passing the wrong coordinates to hexbin. The underying actual coordinates are webmercator meters. The hexbin call needs to operate on the same coordinates as the scatter. Also you had set the size as 0.5 (meter) which results in invisible points on this scale. A more reasonable value might be 1000 or more. Here is a complete version:

import pandas as pd
import numpy as np
from bokeh.tile_providers import get_provider, Vendors
from bokeh.plotting import figure, show, output_file
from bokeh.models import HoverTool

def wgs84_to_web_mercator(df, lon="longitud", lat="latitud"):
    """Converts decimal longitude/latitude to Web Mercator format"""
    k = 6378137
    df["x"] = df[lon] * (k * np.pi/180.0)
    df["y"] = np.log(np.tan((90 + df[lat]) * np.pi/360.0)) * k
    return df
CDMXhex = pd.read_csv('CDMXhex.csv')

CDMXhex= wgs84_to_web_mercator(CDMXhex)
x = CDMXhex['x']
y = CDMXhex['y']
tile_provider = get_provider(Vendors.CARTODBPOSITRON)

p = figure(title="Hexbin for 500 points", match_aspect=False,  x_axis_type="mercator", y_axis_type="mercator", tools="wheel_zoom,reset", x_range=(-11059823.40, -11009374.97), y_range=(2162444.18, 2225046.15))

p.circle(CDMXhex.x, CDMXhex.y, color="red", size=9)

p.grid.visible = True

r, bins = p.hexbin(x,y, size=1000, hover_color="pink", hover_alpha=1)

p.add_tools(HoverTool(
    tooltips=[("count", "@c"), ("(q,r)", "(@q, @r)")],
    show_arrow=True,mode="mouse", point_policy="follow_mouse", renderers=[r]
))
r = p.add_tile(tile_provider)
r.level = "underlay"

show(p)

And the output:

So glad I found this conversation; was pulling my hair out trying to get HEXBIN over MAPS

In the example above the hoovertool returns the hex Q and R, however what I need is hoovertool to return the cursors position relative to X and Y axis. I have achieved this via:

p.add_tools(HoverTool(
tooltips=[("count", "@c"), ("x", "$x{int}"), ("y", "$y{int}")],
show_arrow=True,mode="mouse", point_policy="follow_mouse", renderers=[r]))

however this returns the underlying Mercator coordinates and not the Lat Lng labels as shown on the axis.

How would i go about getting hoovertool to show the cursors position in LAT and LNG relative to the X Y axis?

There is an example here: