Hello!
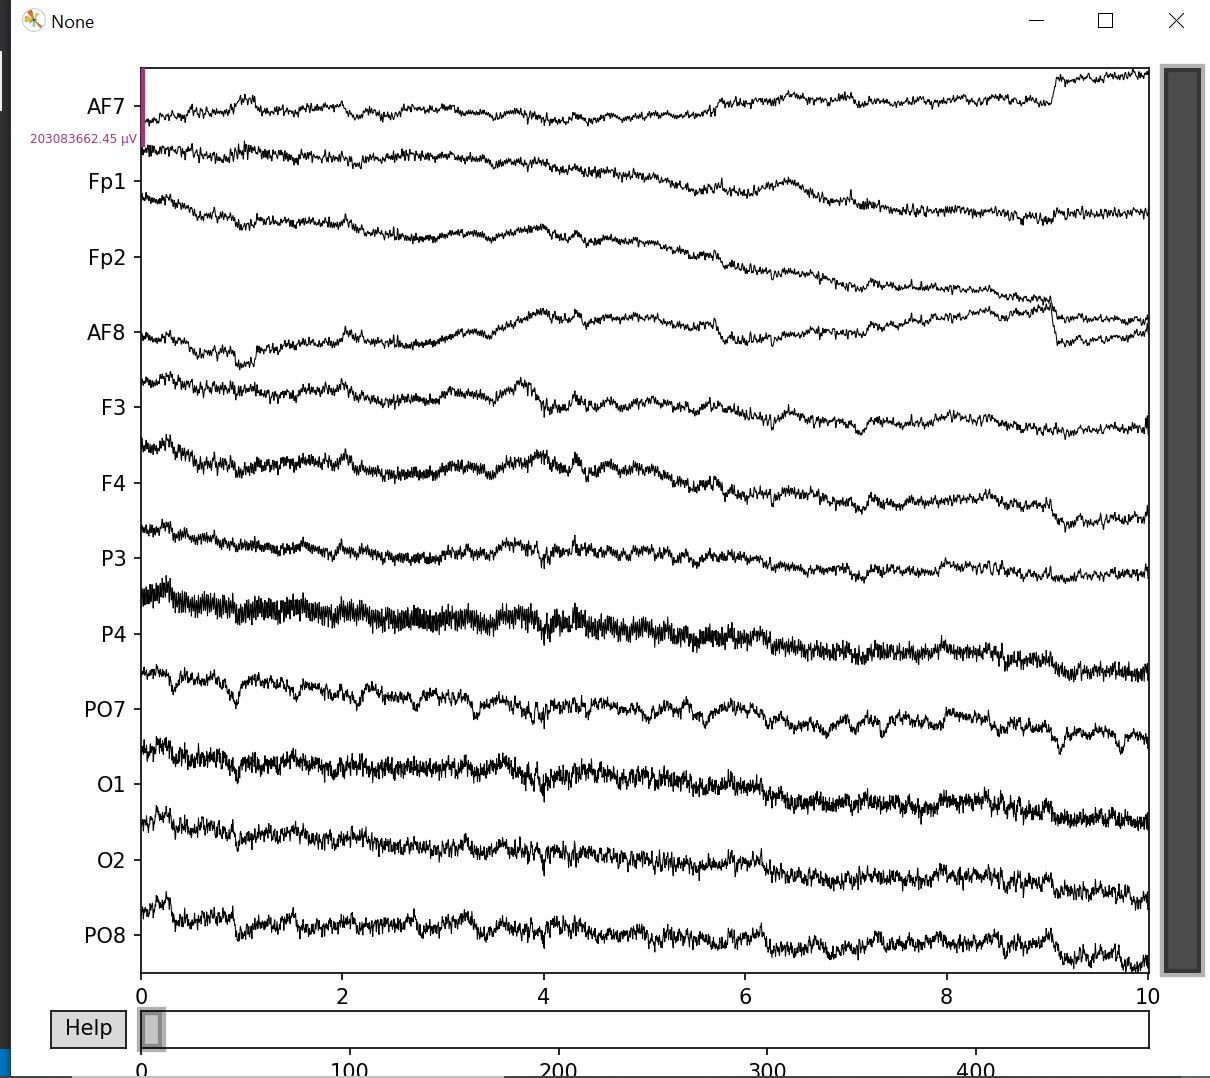
I am currently trying to generate a plot of a multidimensional array (12 channels) of EEG data.
I’d like to visualize the data ordered by number of channel, like in the first picture.
I’ve tried to get something like this, but if I try to plot all the channels in the same graph, they all have the same scale and the order is lost. The closer I got is using the column layout function, but still I’d like to have that same distribution in the same chart.
Is it possible?
Thank you in advance!