Plotting nested categorical data with day of the week and hour - axes overlap

Hello,

I am trying to plot a line graph with nested categorical data having day of the week (monday, tuesday, …) and hours.

sample data below.
(‘1-Monday’, ‘00’)
(‘1-Monday’, ‘01’)
(‘1-Monday’, ‘02’)
(‘1-Monday’, ‘03’)
(‘1-Monday’, ‘04’)
(‘1-Monday’, ‘05’)
(‘1-Monday’, ‘06’)
(‘1-Monday’, ‘07’)

The axes is fine when there is less days. When the data is plotted for 5 days, the hour labels for all 24 hours are overlaping. I tried to format the data but still all the hours are displayed. Is there a way to reduce the number of ticks for hours for each day?? or is there a way that day-hour (not date-hour) can be set to x-axis so that nested categorical plot could be avoided.

Hi,
Would it be possible to give a minimal example code, so that it’s easier to figure out the issue?

Thank you :slight_smile:

Hello,

Below is the sample code.

df = pd.read_excel(r'output.xlsx')
df_ref = pd.read_excel(r'3G_Ref.xlsx')
df_final = df.merge(df_ref,how='inner', left_on=['HOUR_ID', 'Day_NAME','WEEKDAY_ID'], right_on=['HOUR_ID', 'Day_NAME','WEEKDAY_ID'])
df_final['Day_ID'] = df_final['WEEKDAY_ID'].astype(str)+'-'+df_final['Day_NAME'].astype(str)
df_final["Hour"] = df_final.HOUR_ID.map("{:02}".format)
df_final['x-axis'] = tuple(zip(df_final['Day_ID'],df_final['Hour'].astype(str)))    
df_final.sort_values('x-axis',inplace=True)
curdoc().theme = 'dark_minimal'
plot_dod=figure(plot_width=1000,plot_height=500,toolbar_location="right",
                x_range=FactorRange(*pd[x]))
plot_dod.xaxis.axis_label="Day - Hour"
plot_dod.xaxis.major_label_orientation = 1.5
plot_dod.xaxis.major_label_text_font = "arial"
plot_dod.xaxis.major_tick_line_color = None
plot_dod.xaxis.major_label_text_font_size = "7pt"
plot_dod.xaxis.group_text_font_size = "10pt"
plot_dod.xaxis.separator_line_dash_offset = 0
plot_dod.xaxis.major_label_standoff = 3
cds = ColumnDataSource(df_final)
plot_dod.line(x = 'x-axis',y = 'data',color='orange',line_width=2, alpha=1, legend_label = "Live",source = cds)
plot_dod.line(x = 'x-axis',y = 'data_ref',color='cadetblue',line_width=2,line_dash='dashed', alpha=1, legend_label = "Ref",source = cds)

It looks like when plotting, the hour is still considered as string and showing all the values. I have also attached the snapshot how it looks like… (data is week over week hourly comparison per day)

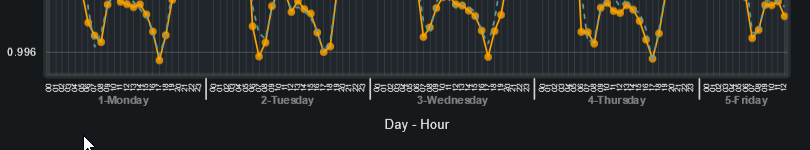
If I add all the 7 days, then the hour labels are overlapped. I can make the figure size bigger, but that is not the solution as there are multiple graphs to be displayed

@koti_maddala It’s not clear to me what your preference is, would you ideally still have a categorical axis, only with fewer labels? If so you would need to create a custom extension similar to this StackOverflow answer. The built in categorical axis always shows all categorical factors that are defined.

Alternatively, are you looking for an actual dynamically scaling datetime (non-categorical) axis? If so you would need to convert your categorical values in to real datetime values and set x_axis_type="datetime" in the call to figure (and also not set the x_range to a list of categories).