I have three columns of data. X and Y and standard deviation(STD).
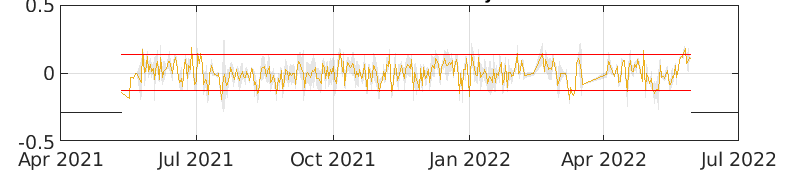
Which of the plot commands can I draw a figure like the one below? (This figure was drawn by MATLAB)
My problem is how to plot the gray part!
Probably a band: Adding annotations — Bokeh 2.4.3 Documentation
1 Like
This topic was automatically closed 90 days after the last reply. New replies are no longer allowed.